

Elastic Demo Gallery
Little examples designed to let you explore various facets of the Elastic Stack, from Kibana dashboards and Canvas workpads to Elasticsearch SQL snippets and machine learning jobs. Because trying is better than seeing.
FILTERS
Solutions
Elastic Features
Observability
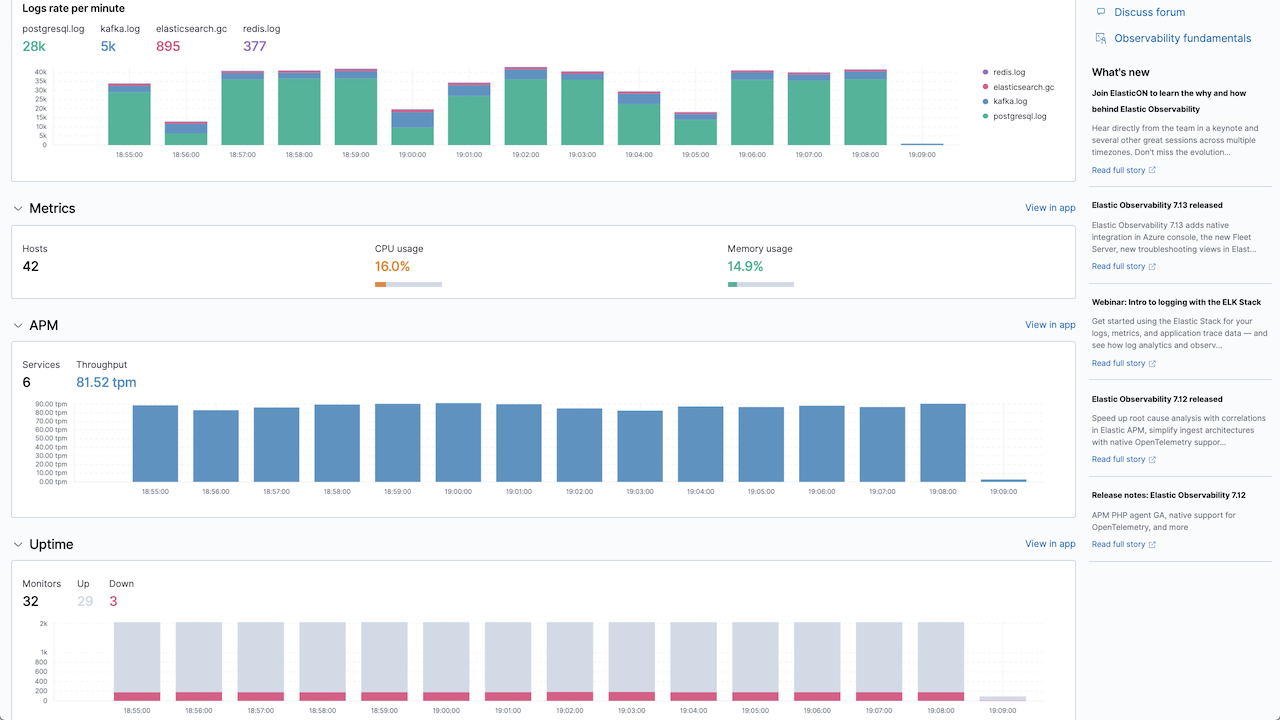
Observability Overview
Try out this hands-on demo to learn how to bring your logs, metrics, and traces together for complete visibility into your application environment.
Search
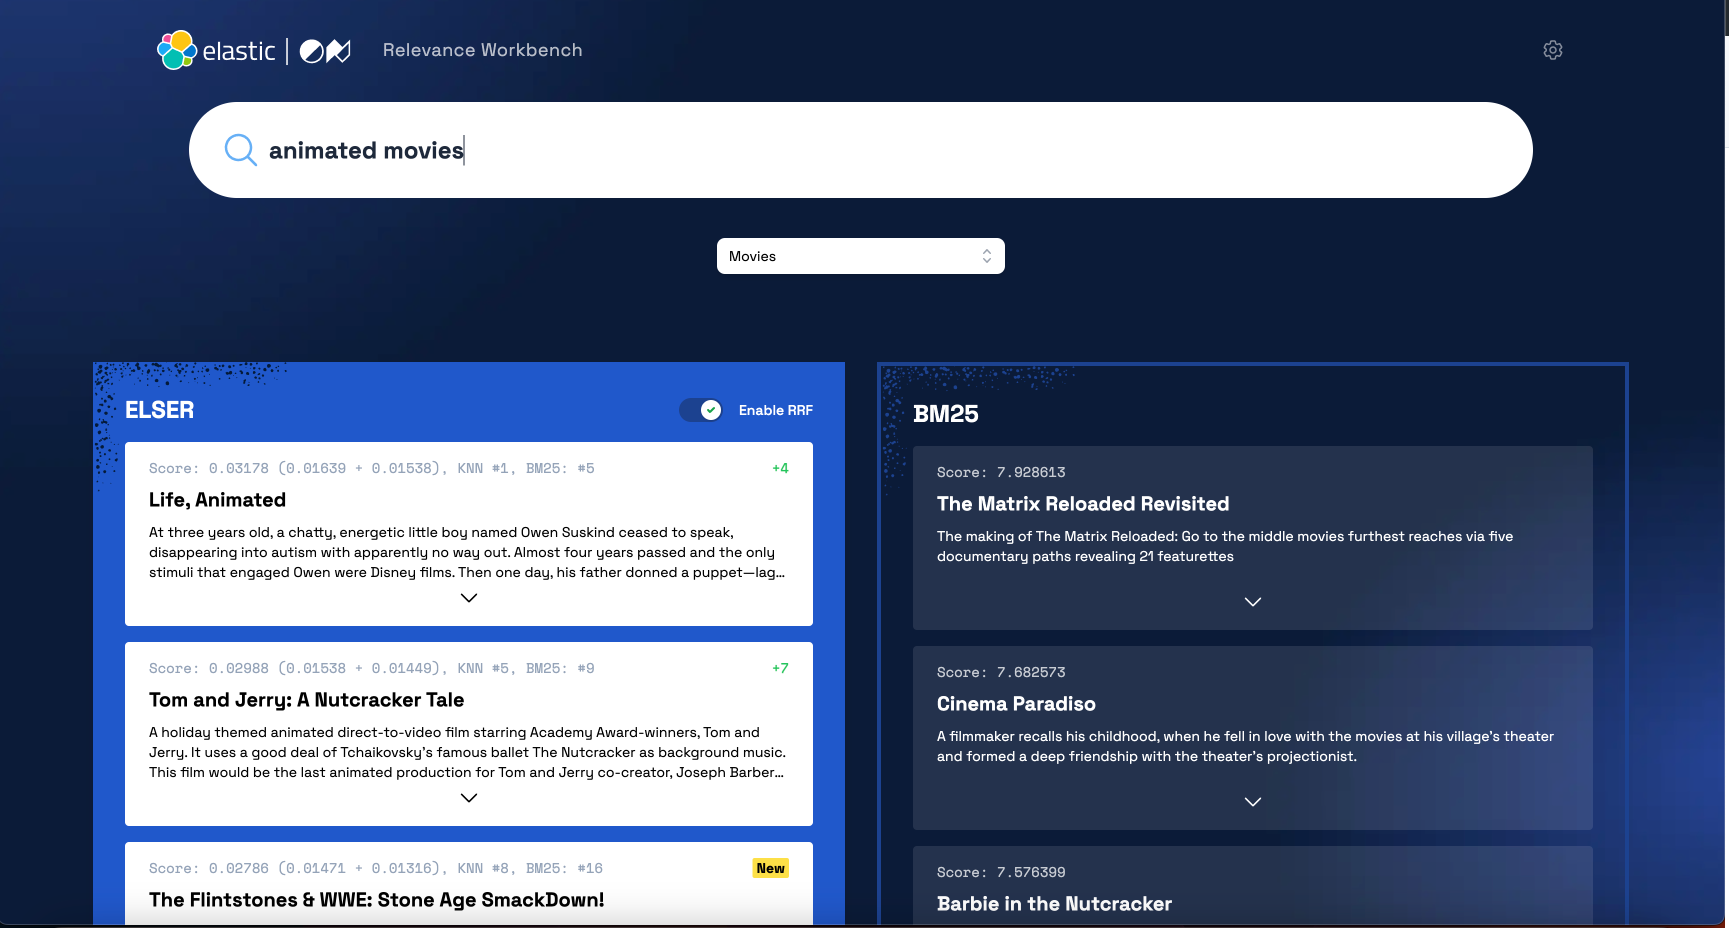
Relevance workbench
In this workbench, you can compare our Elastic Learned Sparse Encoder model (with or without RRF) and traditional textual search using

Search
Movie search application
Try out this live demo of a movie search application built on top of Elastic Search.
The first part is a front end application implemented using Search UI. Feel free to just play with it or clone the code and try yourself!
Observability
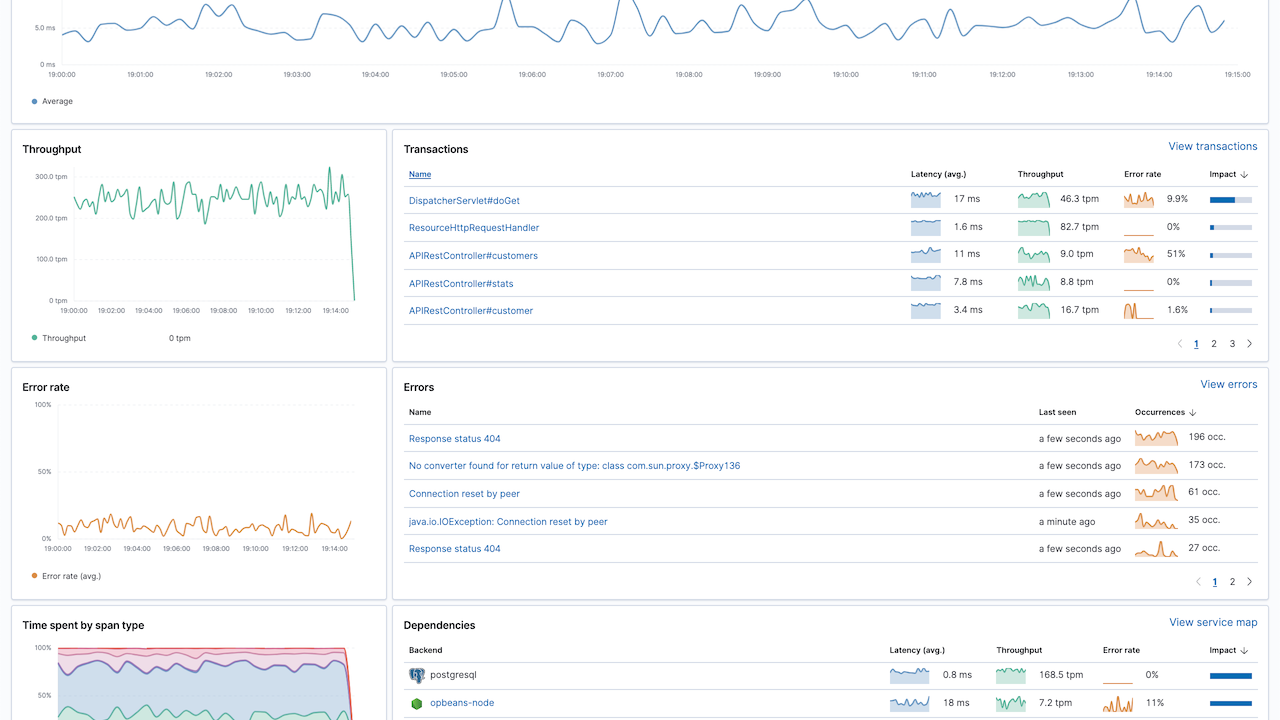
APM - Java
Already housing logs and system metrics in Elasticsearch? Expand to application metrics with free and open Elastic APM. See exactly where your application is spending time so you can quickly fix issues and feel good about the code you push.


Try Elastic Cloud for free
Deploy a 14-day trial of Elasticsearch Service - no credit card required.
For a limited time, new annual subscribers get 3 months free
Start free trial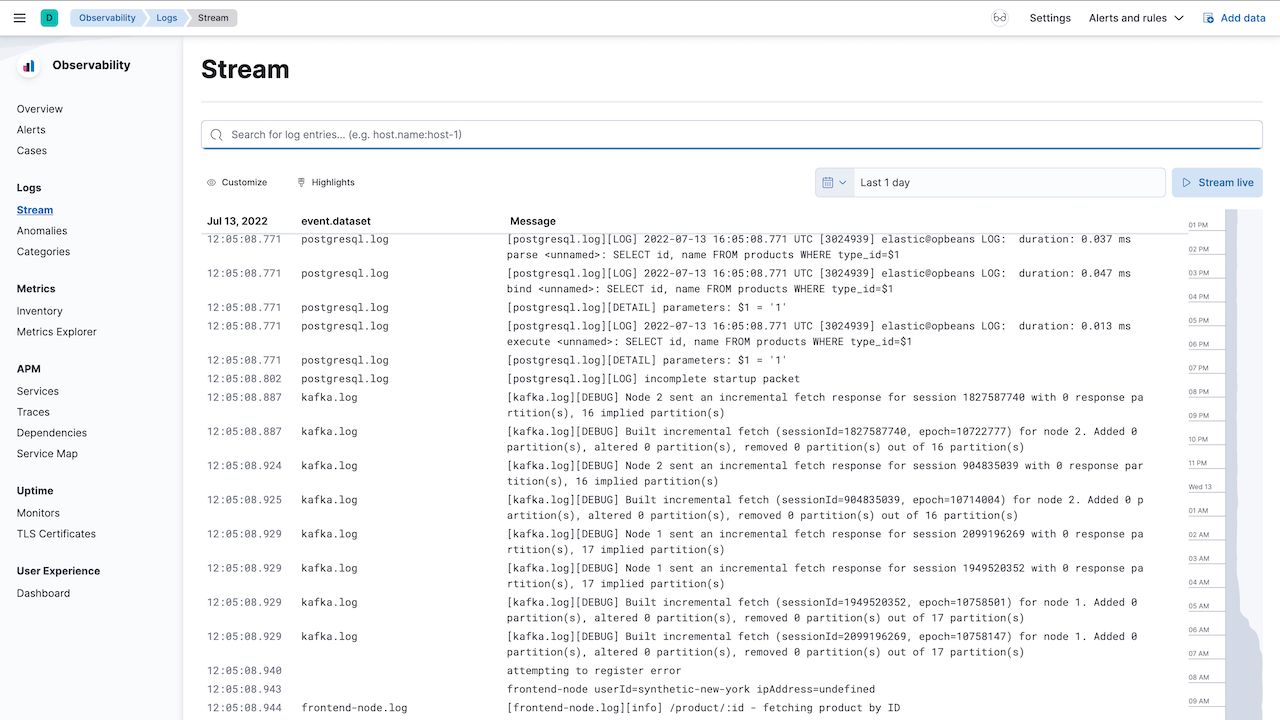
Observability
Logging
Keep a pulse of all log files flowing in from your servers, virtual machines, and containers in a purpose-built and intuitive interface for viewing logs. Pin structured fields and explore related logs without leaving your current screen. Dive into your real-time streaming logs in Kibana for a console-like experience.
Security
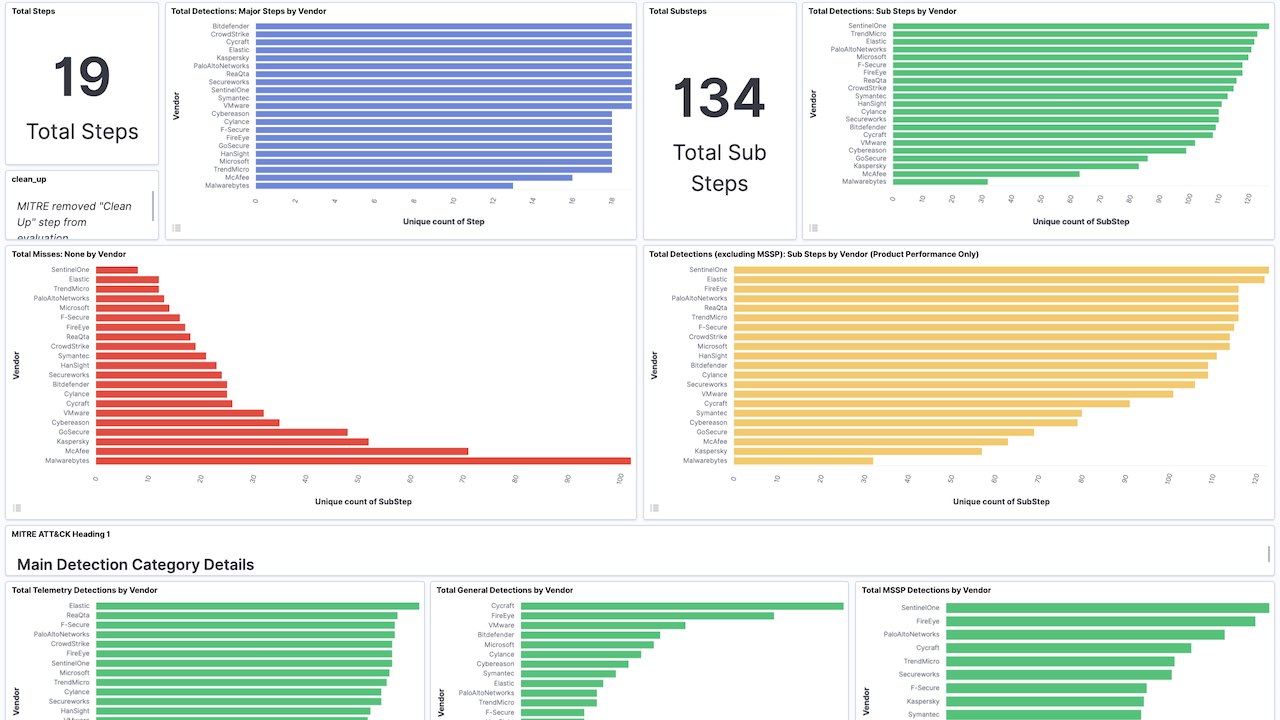
MITRE Round 2 Eval Results
MITRE does an excellent job of testing across tactics and techniques of a simulated APT and presenting the raw data for analysis. They do not score the data or provide any vendor rankings, but many organizations are accustomed to looking for a place to start analyzing the data in a way that can help inform their own evaluation process. MITRE provides a way to look at the results via their Data ...
Canvas
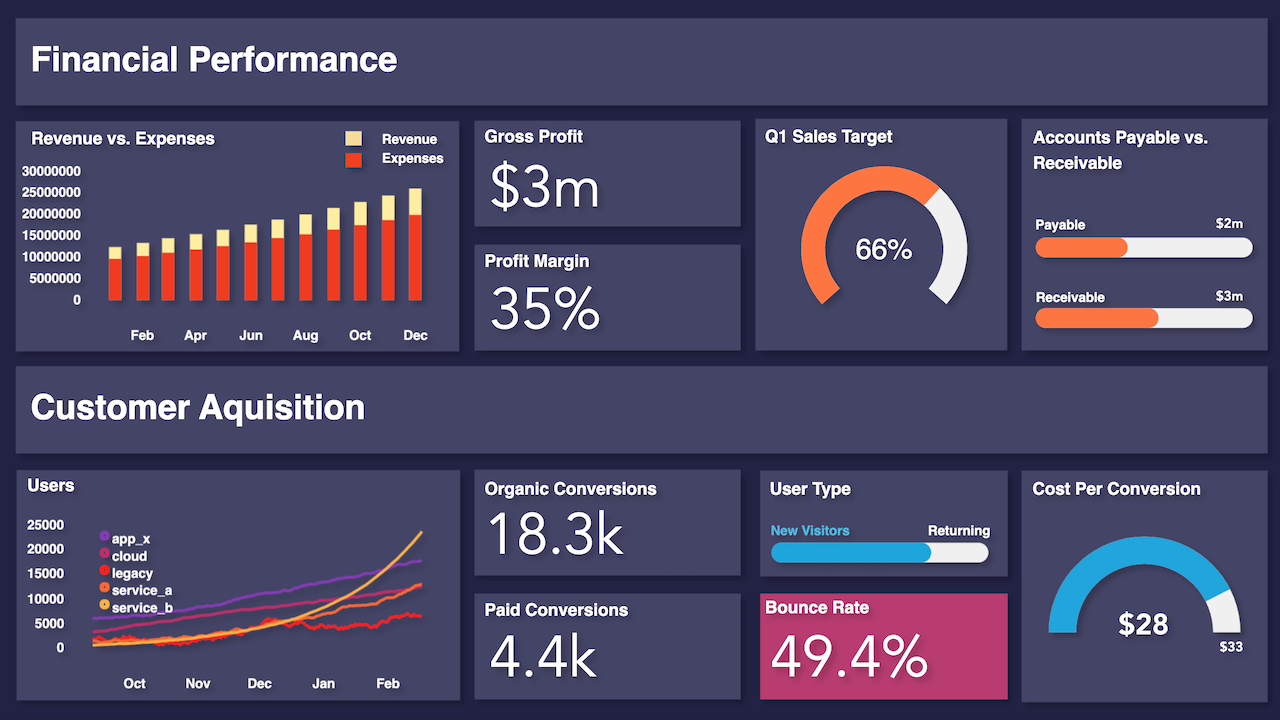
Finance, Sales, and Marketing
Canvas is a data visualization and presentation tool that allows you to pull live data from Elasticsearch, then combine the data with colors, images, text, and your imagination to create dynamic, multi-page, pixel-perfect displays. If you are a little bit creative, a little bit technical, and a whole lot curious, then Canvas is for you.
Map
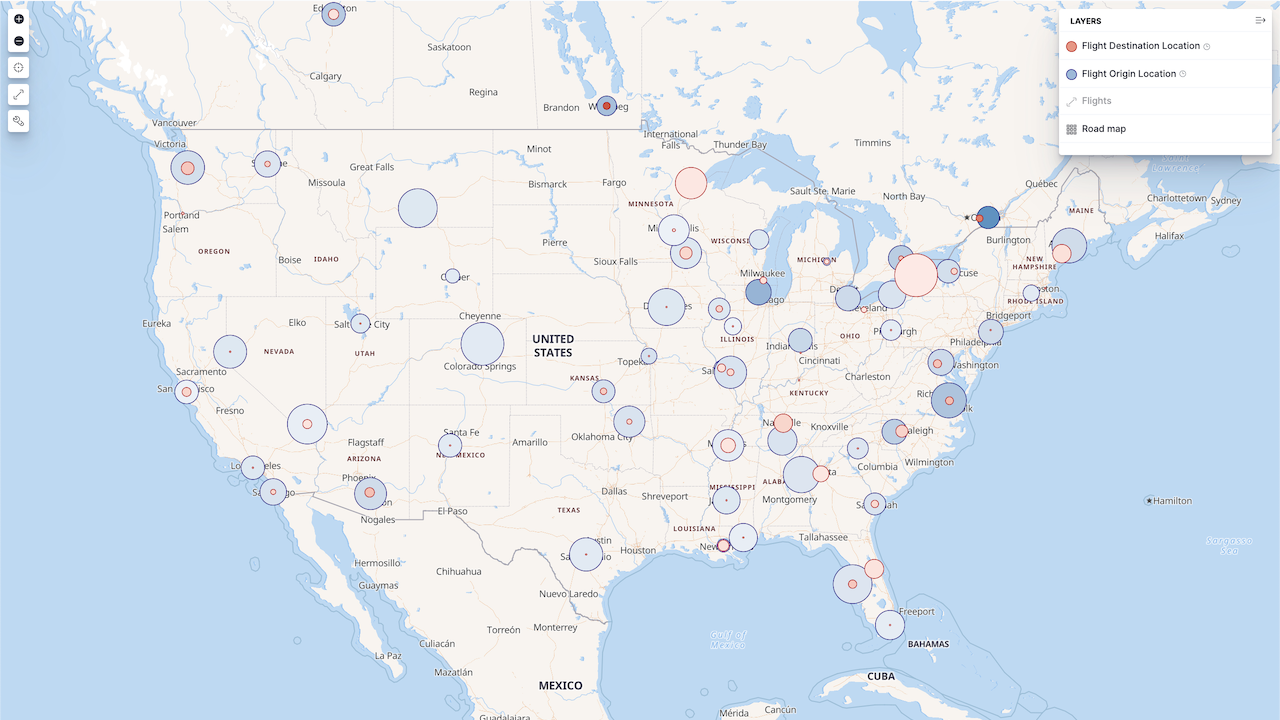
Flight Map
Analyze your geospatial data with Elastic Maps. Visualize multiple indices as unique layers in one view to query and correlate across all of your Elasticsearch data.
