Getting started with the Elastic AI Assistant for Observability and Microsoft Azure OpenAI

Recently, Elastic announced the AI Assistant for Observability is now generally available for all Elastic users. The AI Assistant enables a new tool for Elastic Observability providing large language model (LLM) connected chat and contextual insights to explain errors and suggest remediation. Similar to how Microsoft Copilot is an AI companion that introduces new capabilities and increases productivity for developers, the Elastic AI Assistant is an AI companion that can help you quickly gain additional value from your observability data.
This blog post presents a step-by-step guide on how to set up the AI Assistant for Observability with Azure OpenAI as the backing LLM. Then once you’ve got the AI Assistant set up, this post will show you how to add documents to the AI Assistant’s knowledge base along with demonstrating how the AI Assistant uses its knowledge base to improve its responses to address specific questions.
Set up the Elastic AI Assistant for Observability: Create an Azure OpenAI key
Start by creating a Microsoft Azure OpenAI API key to authenticate requests from the Elastic AI Assistant. Head over to Microsoft Azure and use an existing subscription or create a new one at the Azure portal.
Currently, access to the Azure OpenAI service is granted by applying for access. See the official Microsoft documentation for the current prerequisites.

In the Azure portal, select Azure OpenAI.
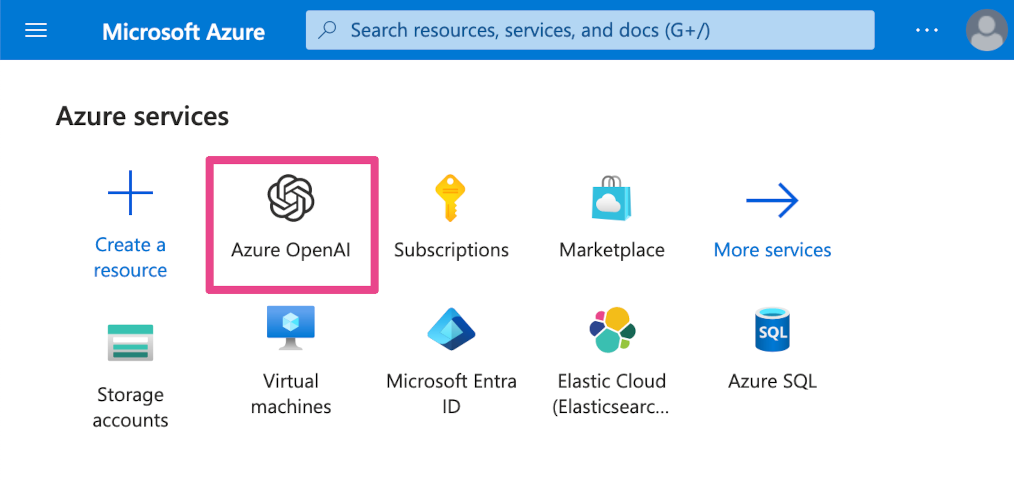
In the Azure OpenAI service, click the Create button.

Enter an instance Name and click Next.
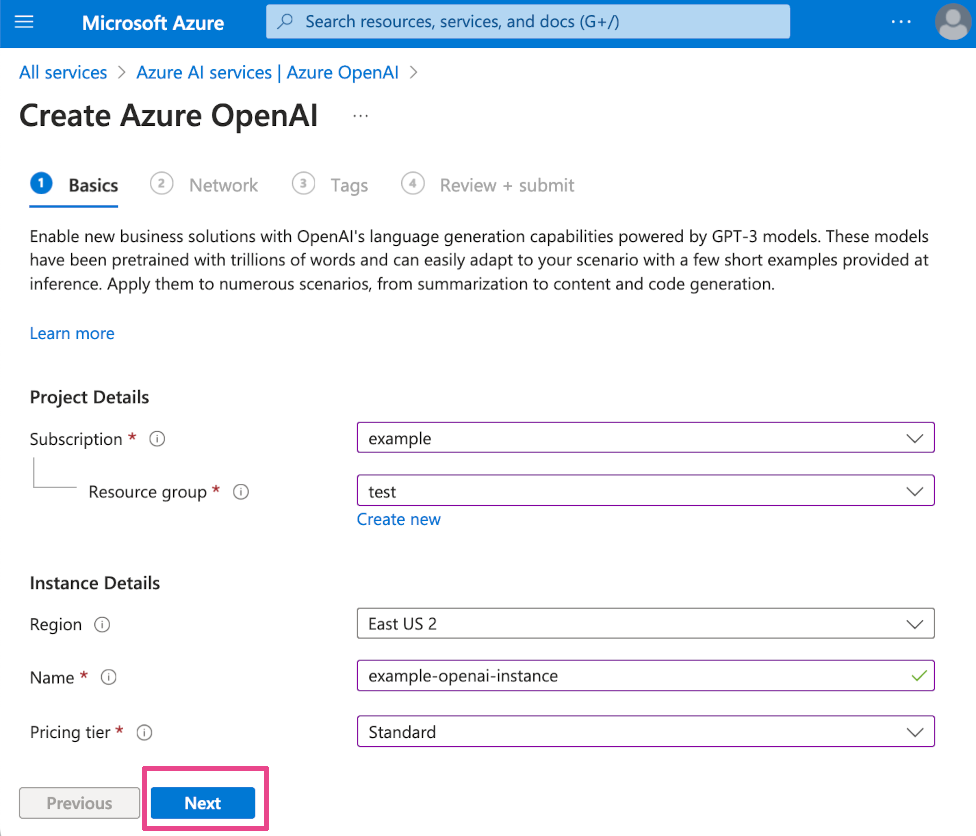
Select your network access preference for the Azure OpenAI instance and click Next.
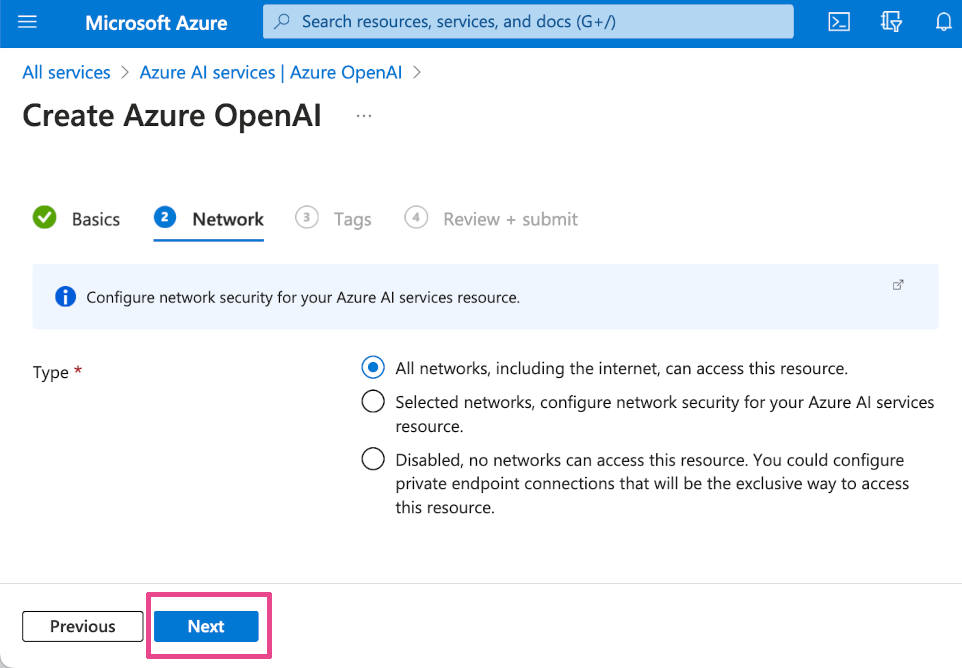
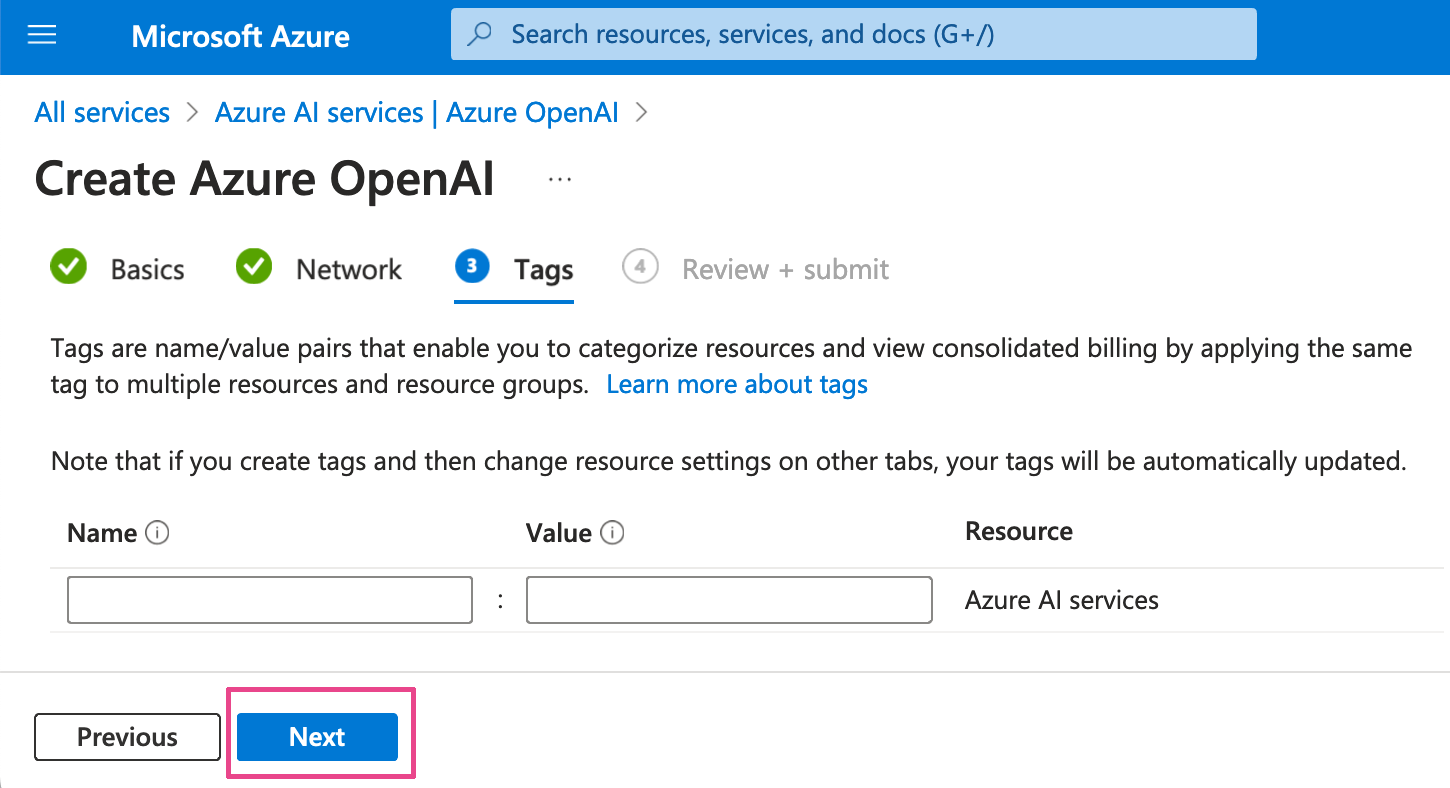
Add optional Tags and click Next.
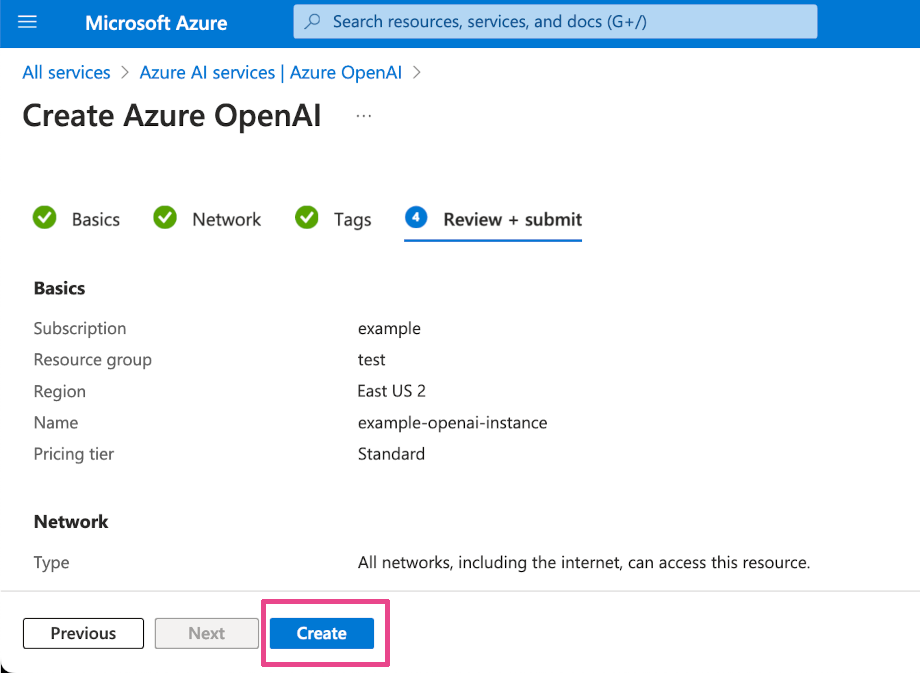
Confirm your settings and click Create to create the Azure OpenAI instance.
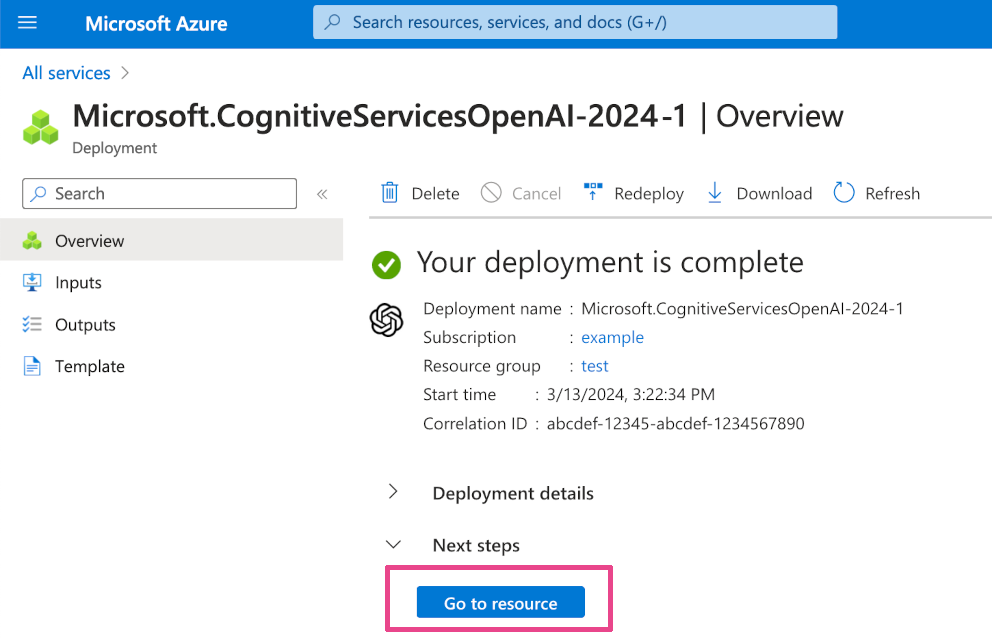
Once the instance creation is complete, click the Go to resource button.
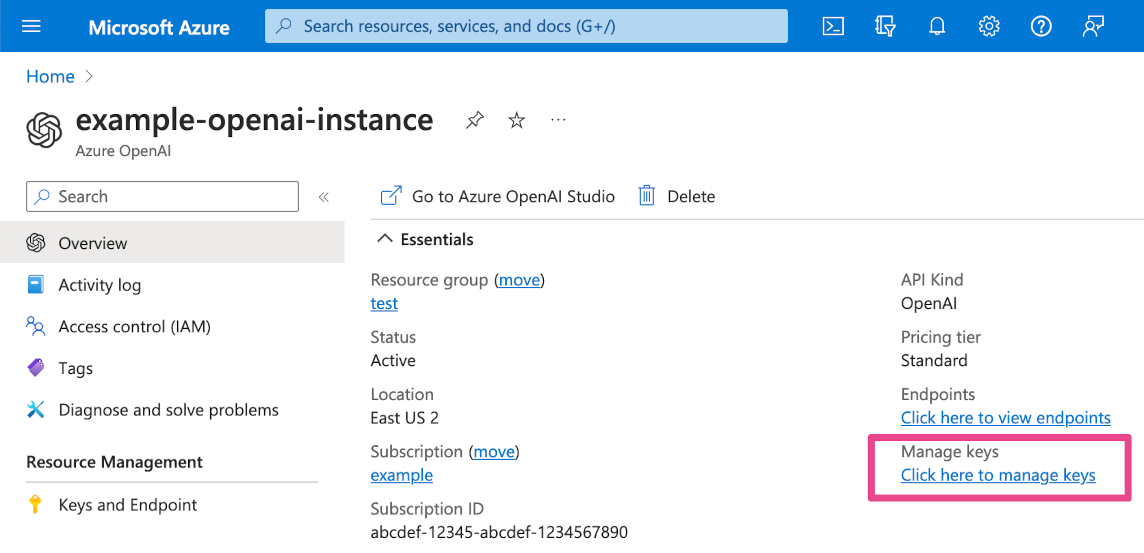
Click the Manage keys link to access the instance’s API key.
Copy your Azure OpenAI API Key and the Endpoint and save them both in a safe place for use in a later step.
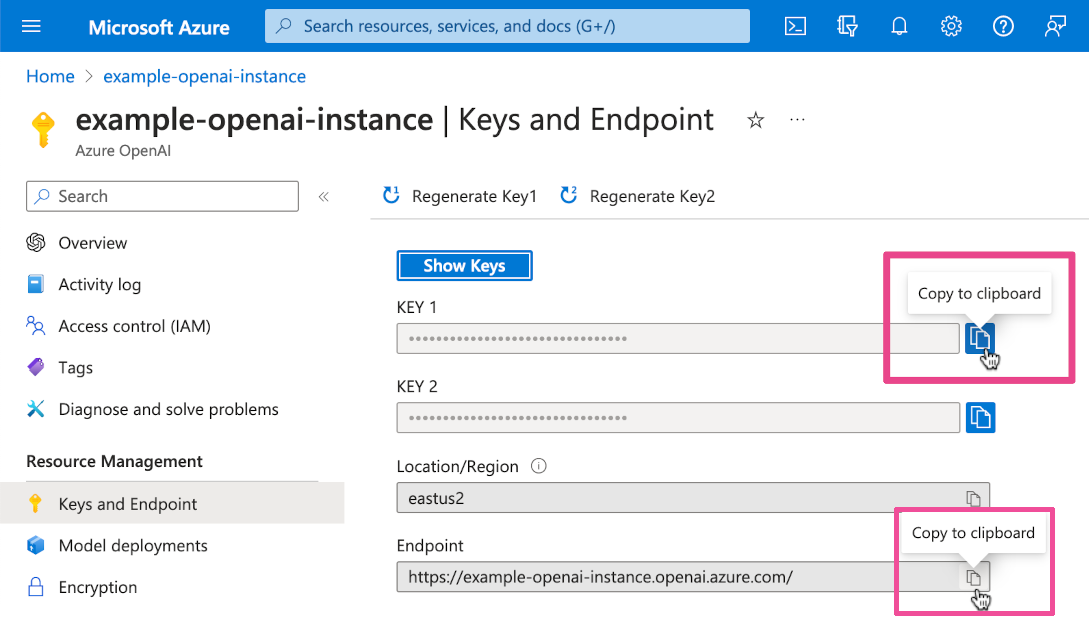
Next, click Model deployments to create a deployment within the Azure OpenAI instance you just created.
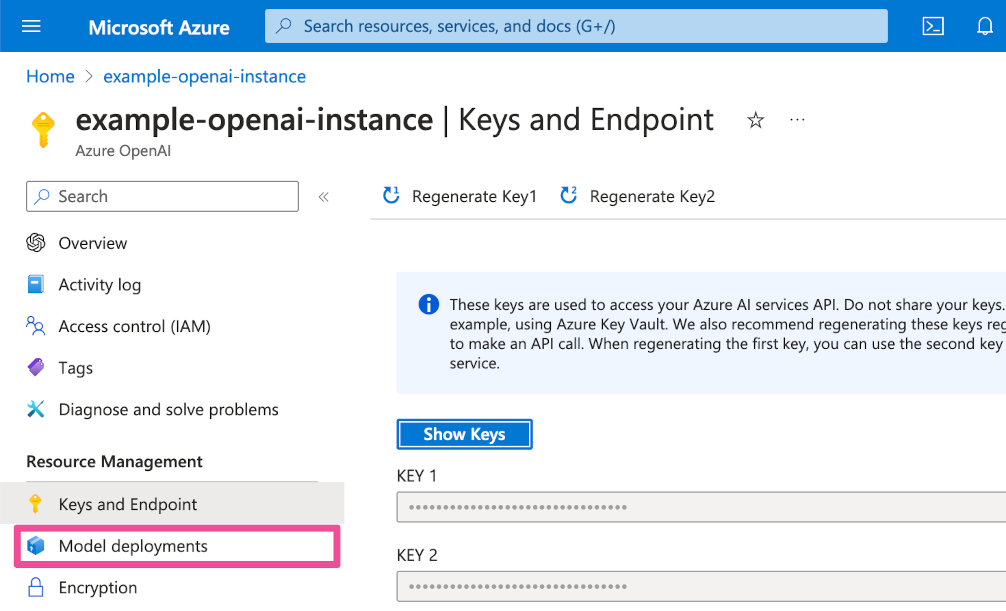
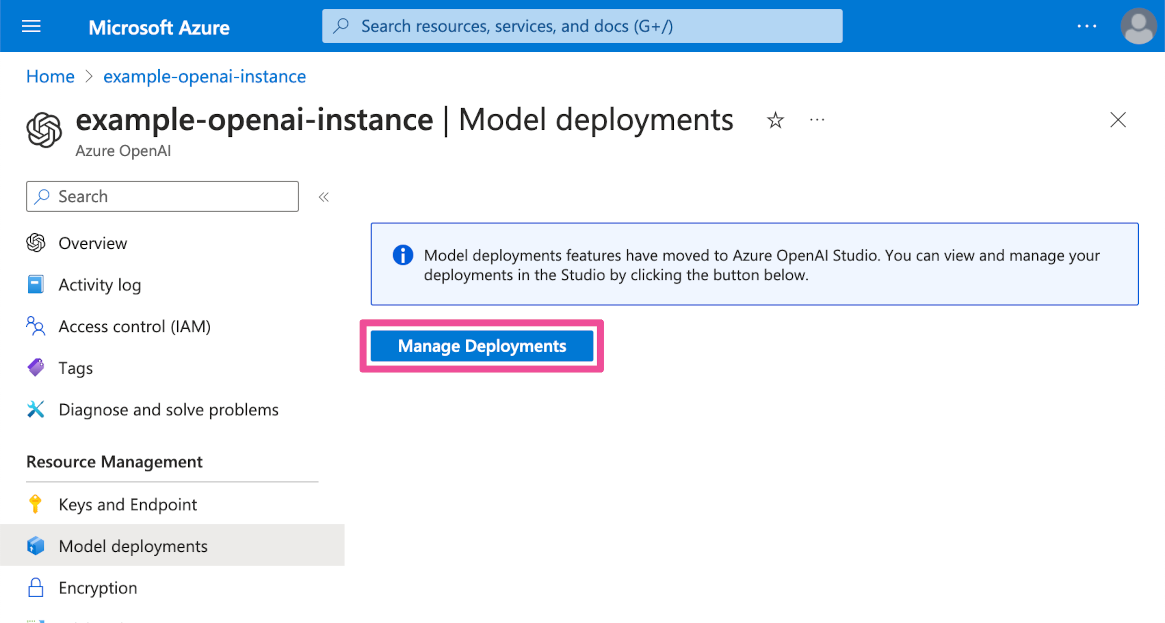
Click the Manage deployments button to open Azure OpenAI Studio.
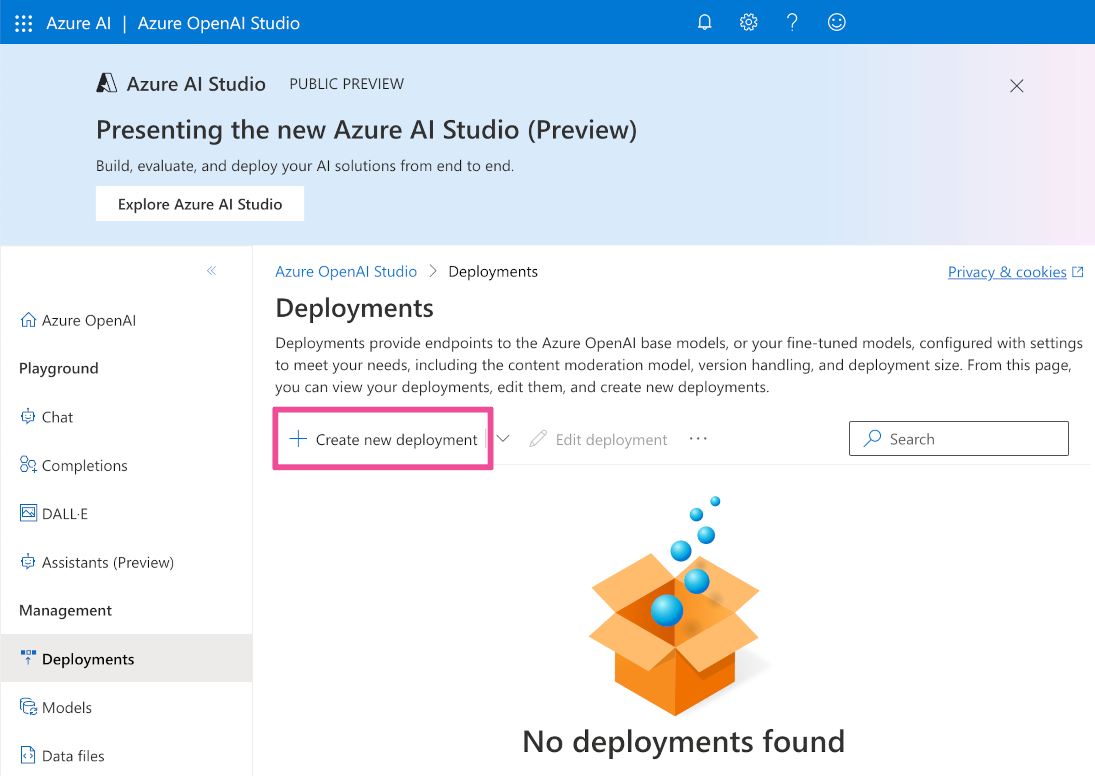
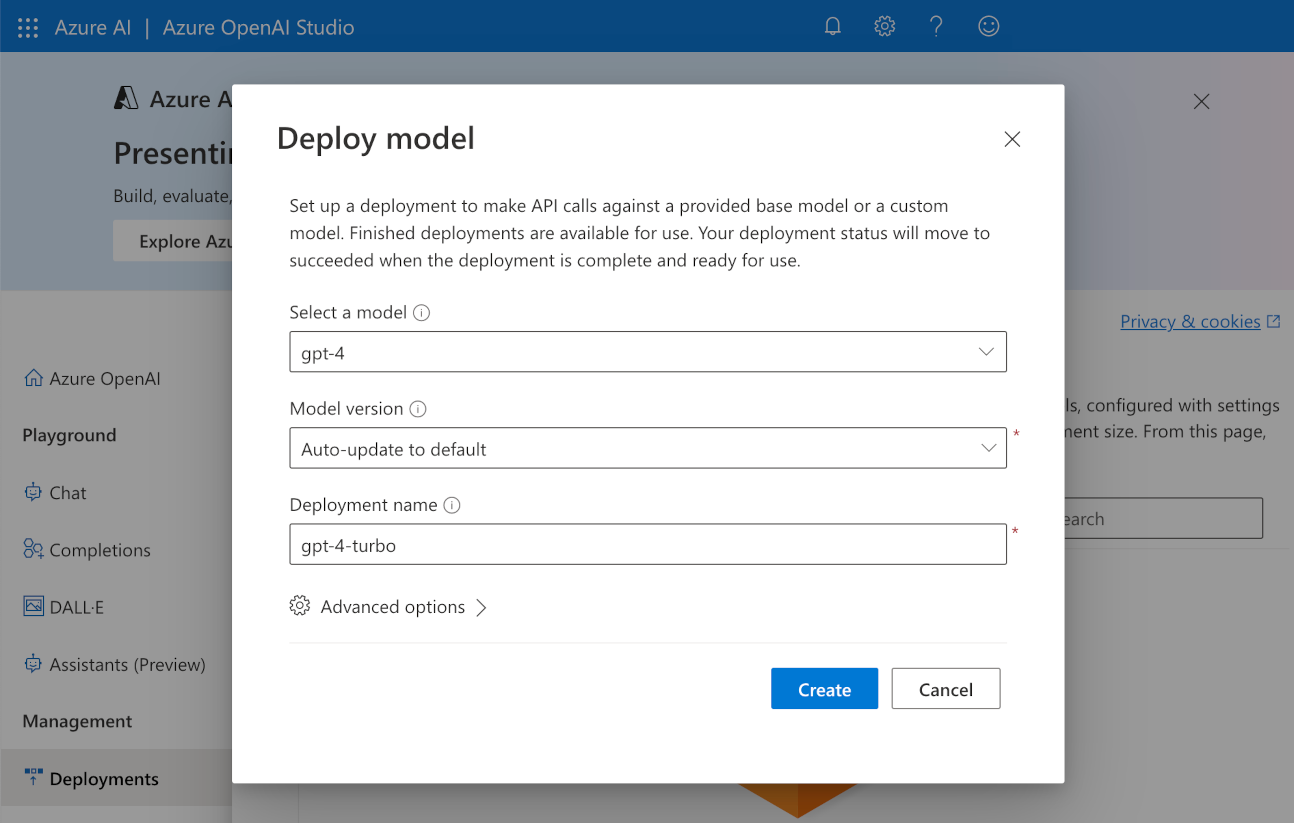
Click the Create new deployment button.
Select the model type you want to use and enter a Deployment name. Note the Deployment name for use in a later step. Click the Create button to deploy the model.
Set up the Elastic AI Assistant for Observability: Create an OpenAI connector in Elastic Cloud
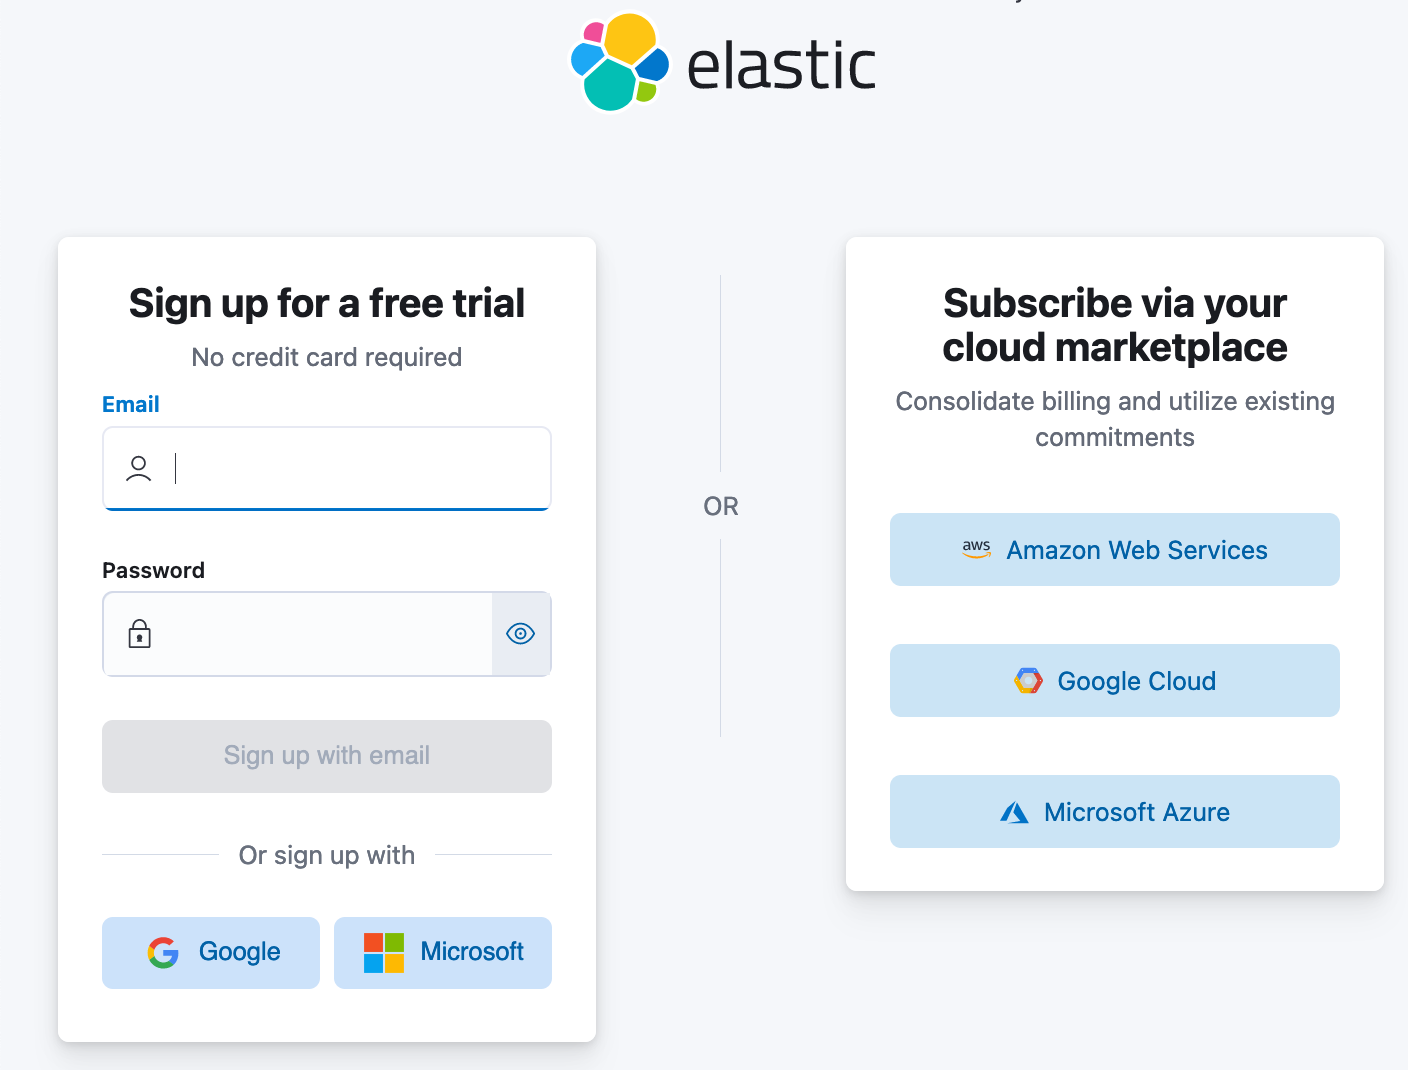
The remainder of the instructions in this post will take place within Elastic Cloud. You can use an existing deployment or you can create a new Elastic Cloud deployment as a free trial if you’re trying Elastic Cloud for the first time. Another option to get started is to create an Elastic deployment from the Microsoft Azure Marketplace.
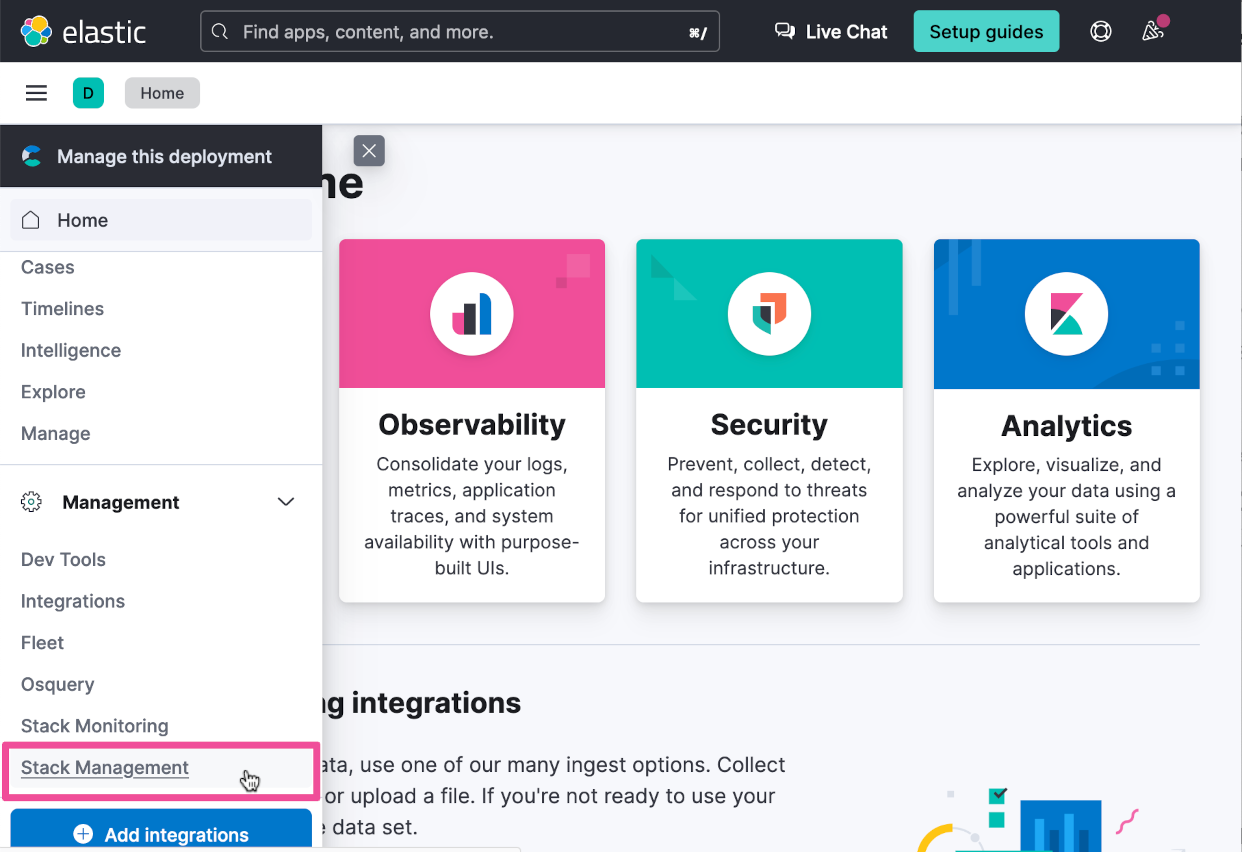
The next step is to create an Azure OpenAI connector in Elastic Cloud. In the Elastic Cloud console for your deployment, select the top-level menu and then select Stack Management.
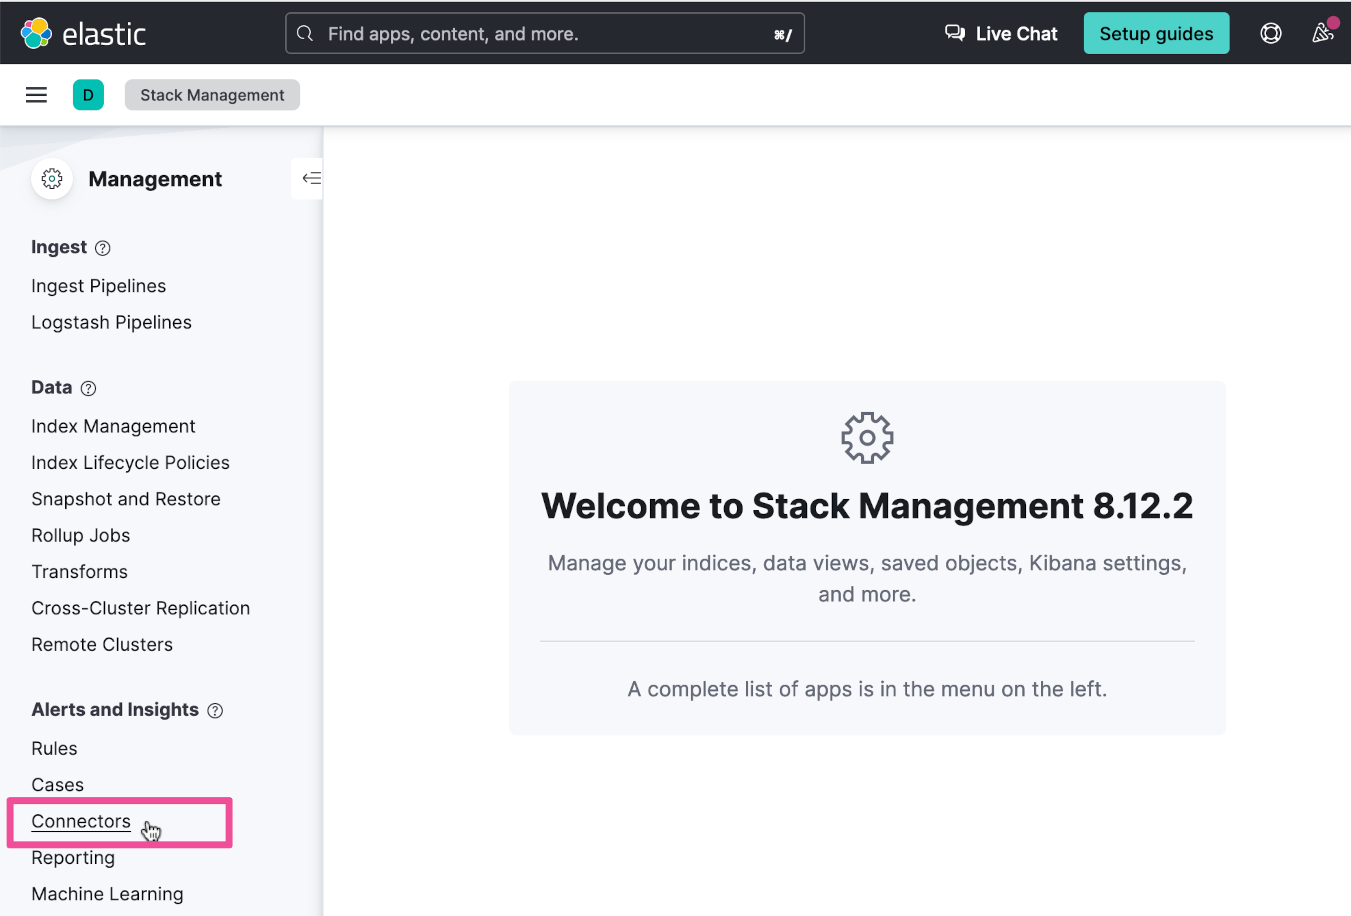
Select Connectors on the Stack Management page.
Select Create connector.
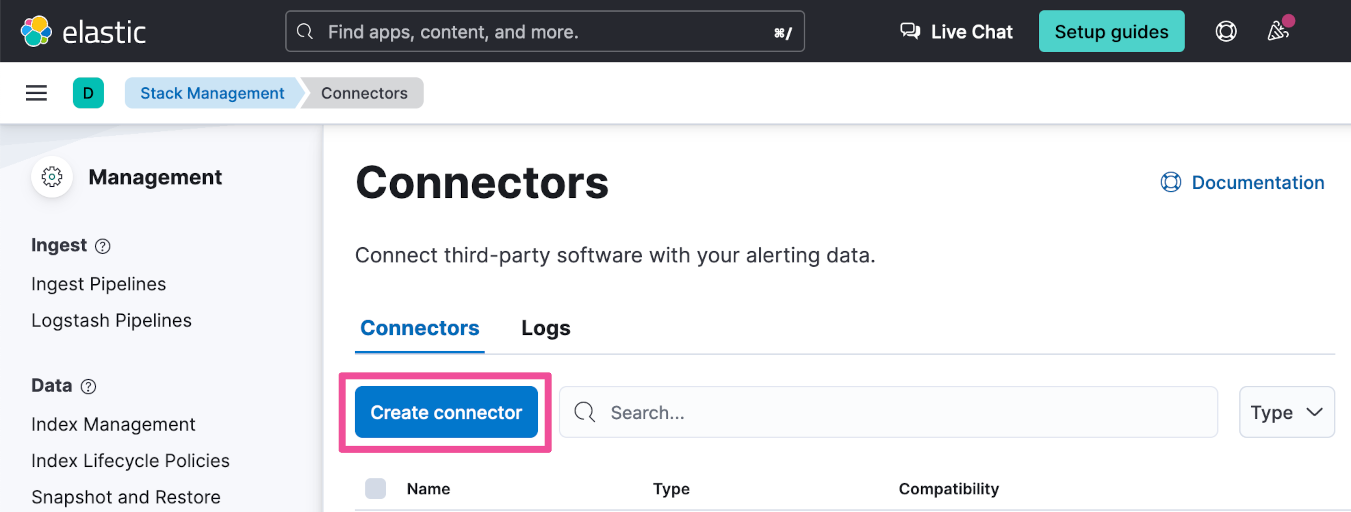
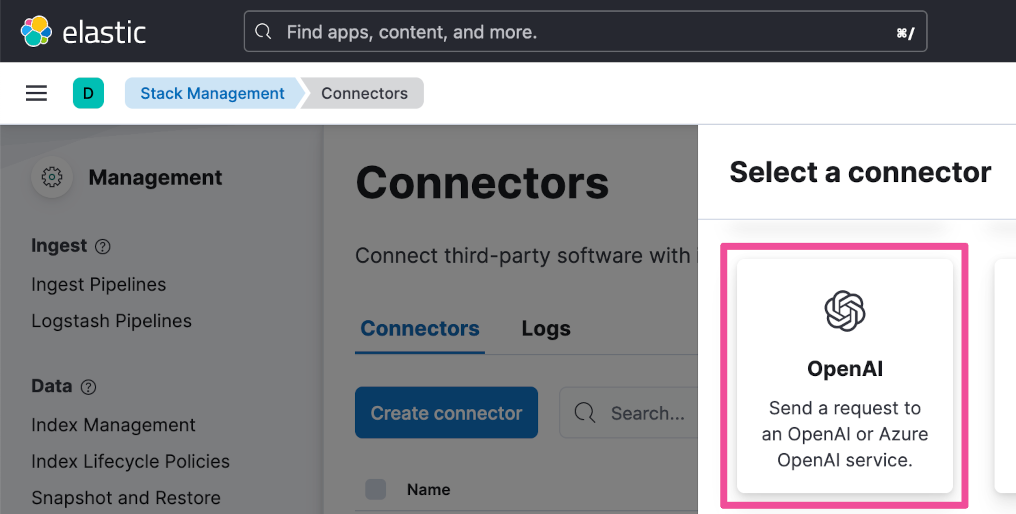
Select the connector for Azure OpenAI.
Enter a Name of your choice for the connector. Select Azure OpenAI as the OpenAI provider.
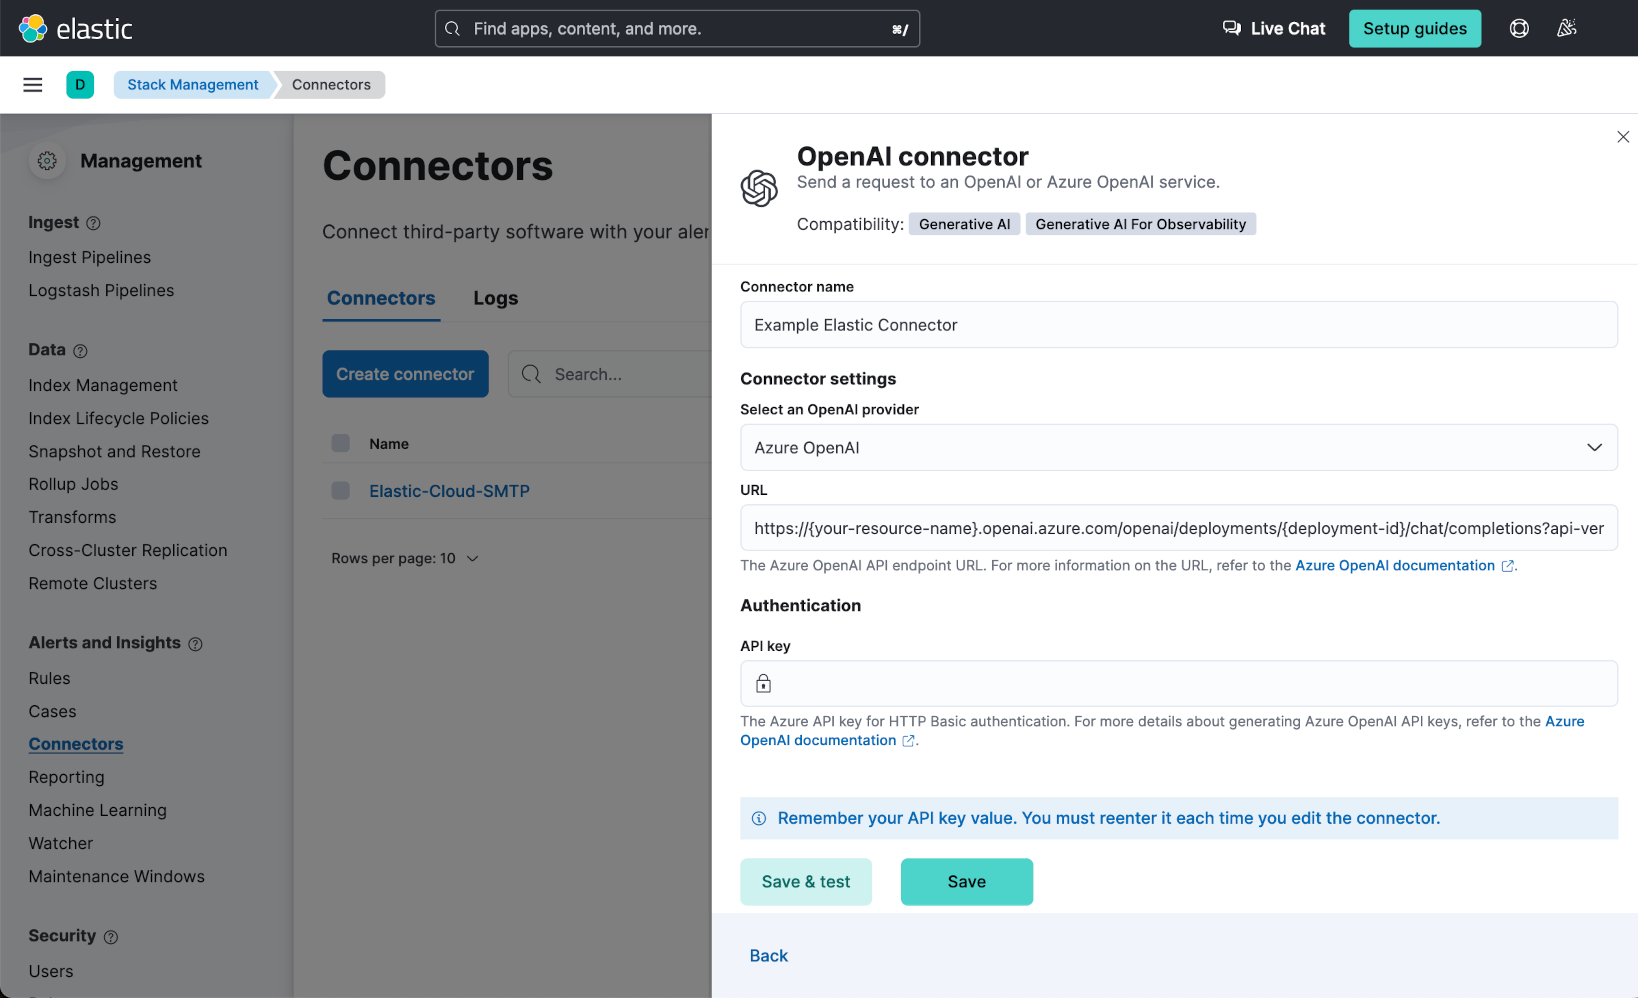
Enter the Endpoint URL using the following format:
Replace {your-resource-name} with the name of the Azure Open AI instance that you created within the Azure portal in a previous step.
Replace {deployment-id} with the Deployment name that you specified when you created a model deployment within the Azure portal in a previous step.
- Replace {api-version} with one of the valid Supported versions listed in the Completions section of the Azure OpenAI reference page.
https://{your-resource-name}.openai.azure.com/openai/deployments/{deployment-id}/chat/completions?api-version={api-version}Your completed Endpoint URL should look something like this:
https://example-openai-instance.openai.azure.com/openai/deployments/gpt-4-turbo/chat/completions?api-version=2024-02-01Enter the API Key that you copied in a previous step. Then click the Save & test button.
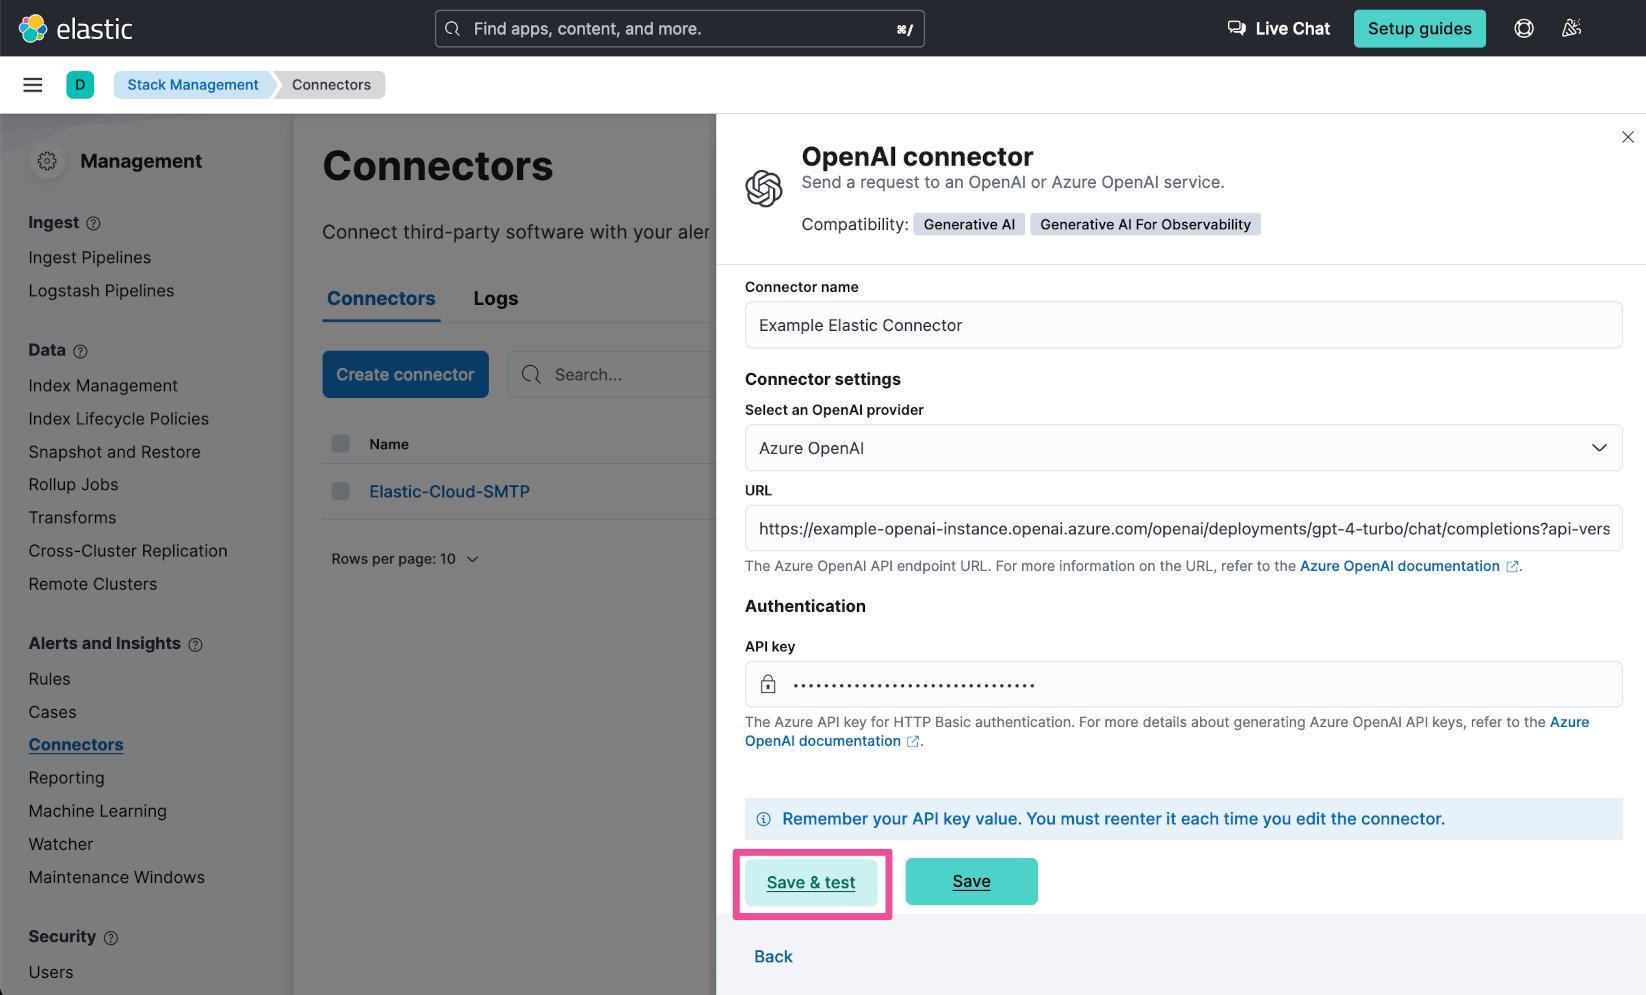
Within the Edit Connector flyout window, click the Run button to confirm that the connector configuration is valid and can successfully connect to your Azure OpenAI instance.
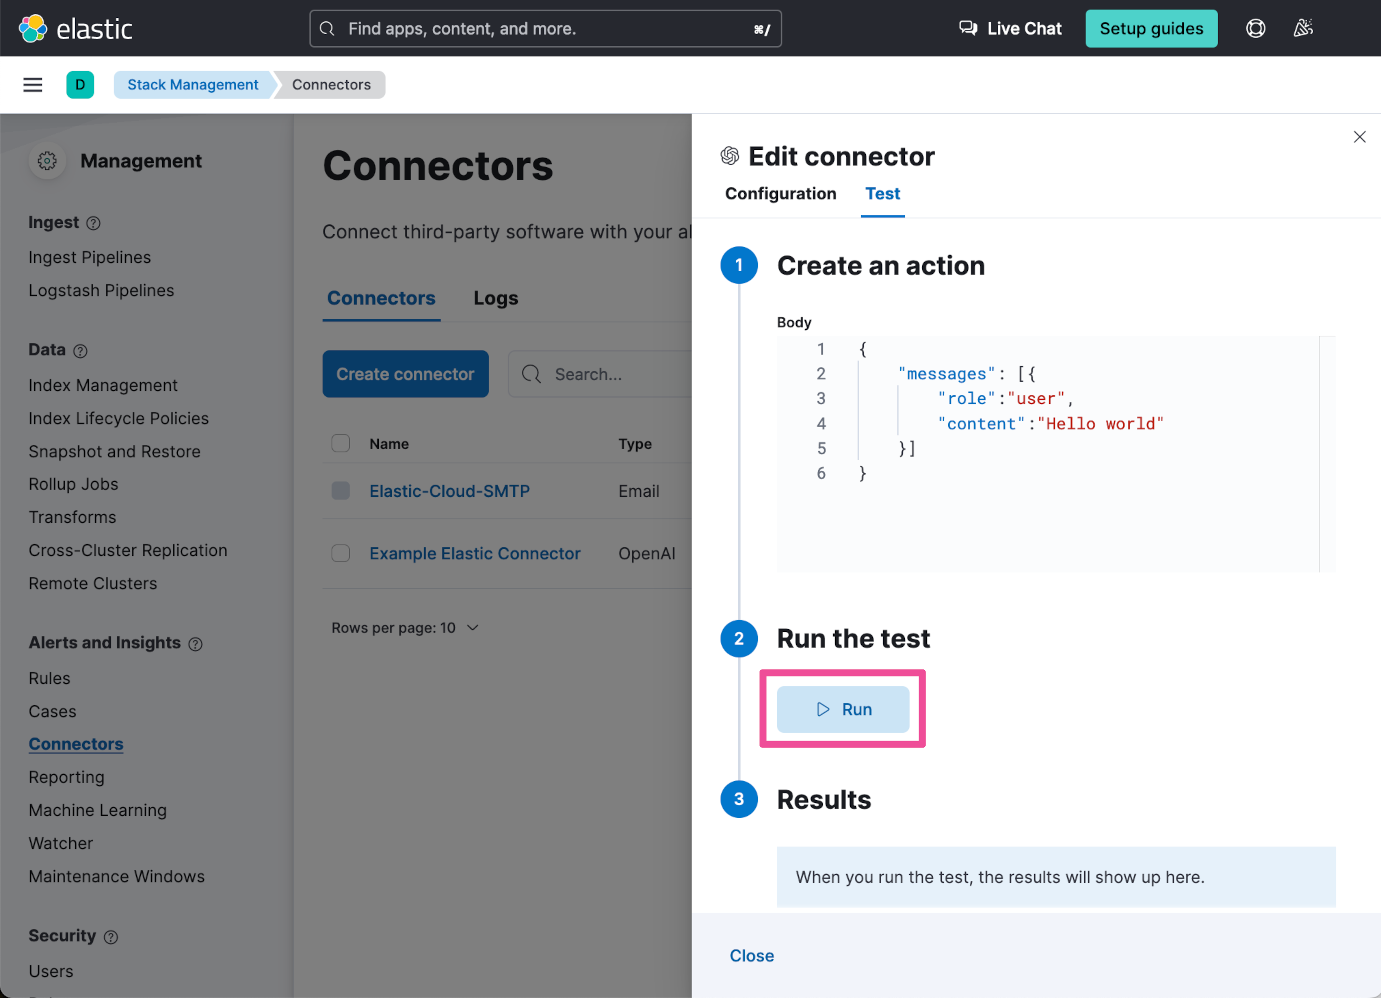
A successful connector test should look something like this:
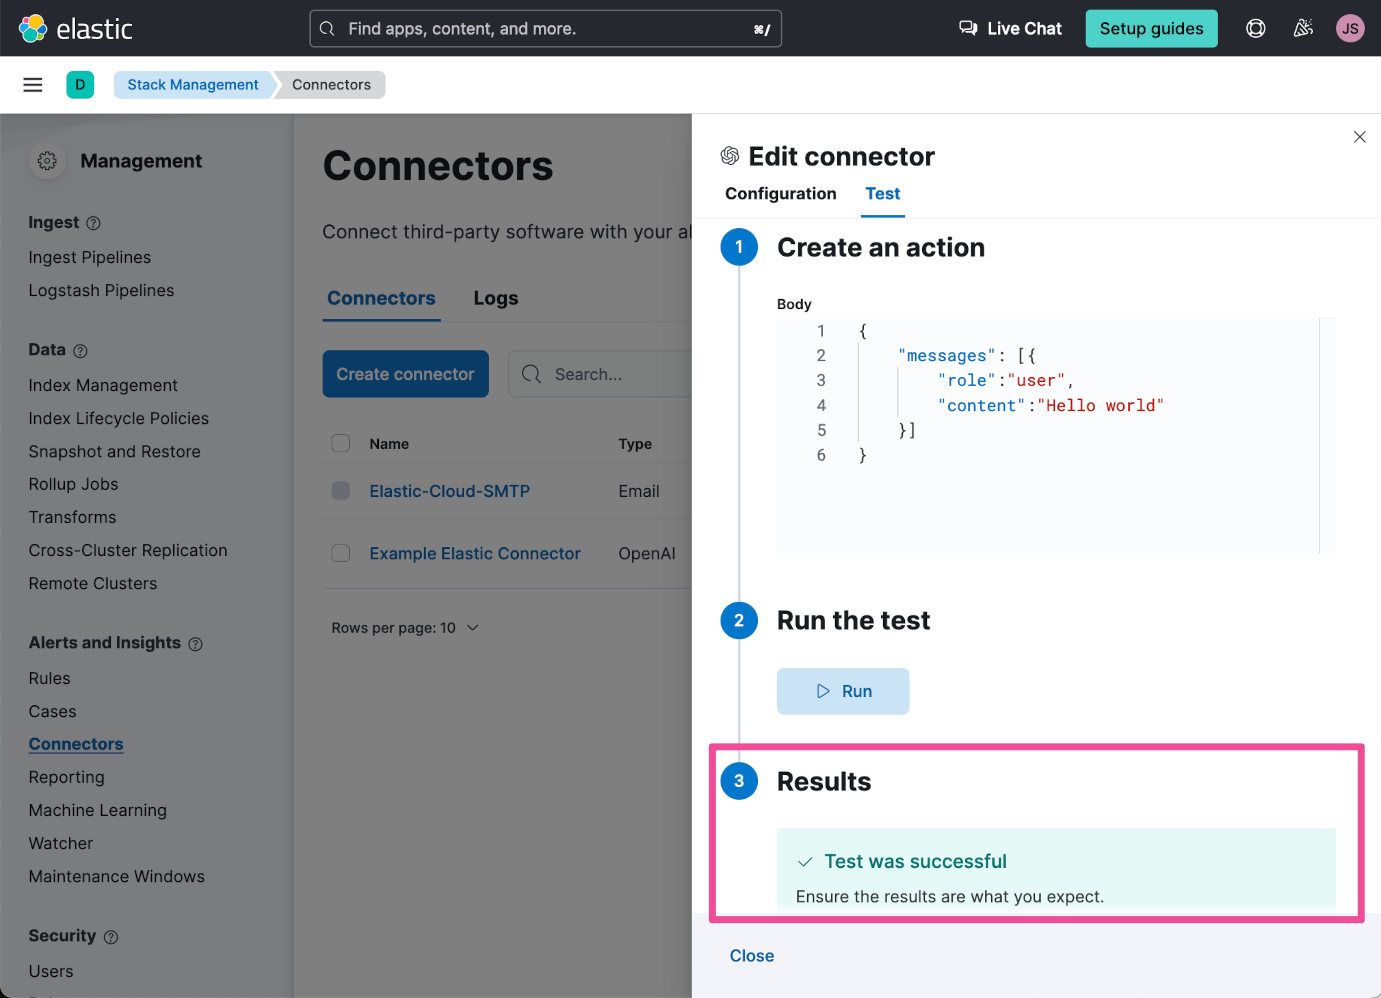
Add an example logs record
Now that you have your Elastic Cloud deployment set up with an AI Assistant connector, let’s add an example logs record to demonstrate how the AI Assistant can help you to better understand logs data.
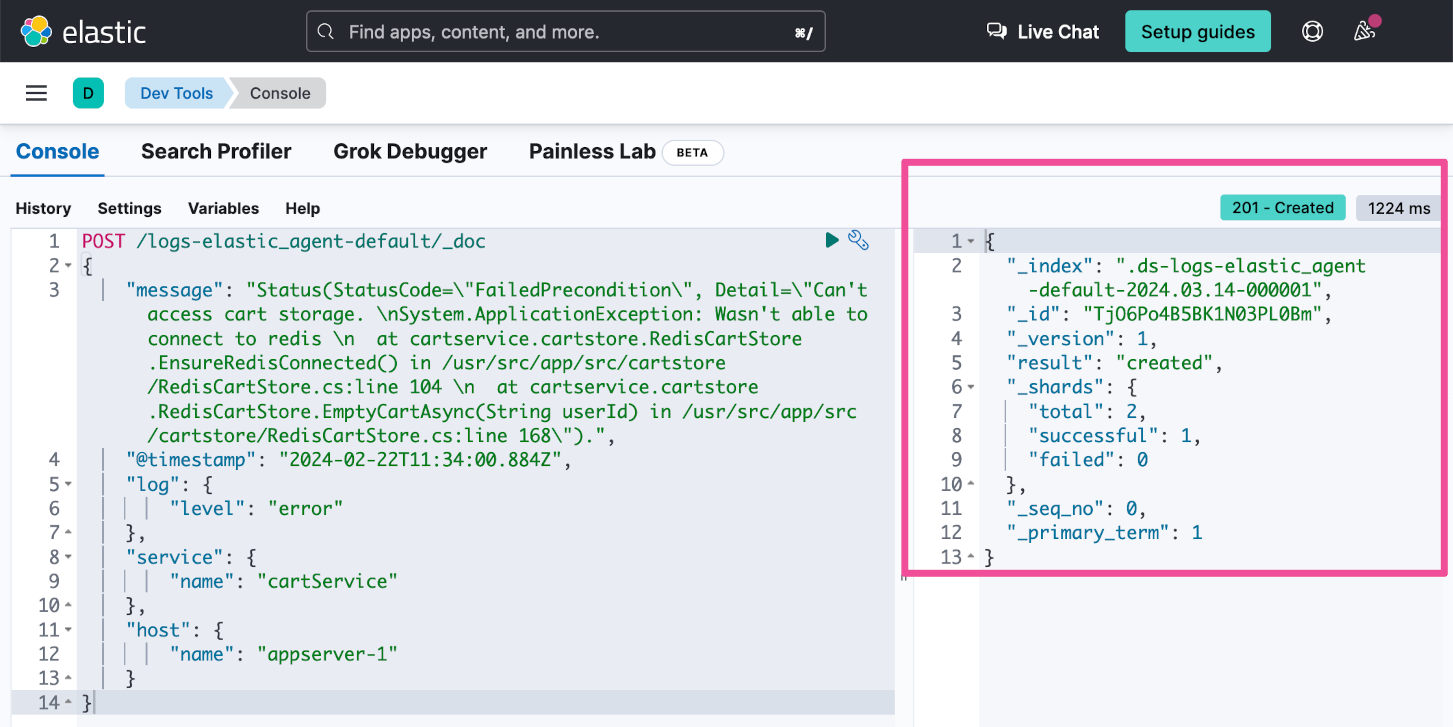
We’ll use the Elastic Dev Tools to add a single logs record. Click the top-level menu and select Dev Tools.
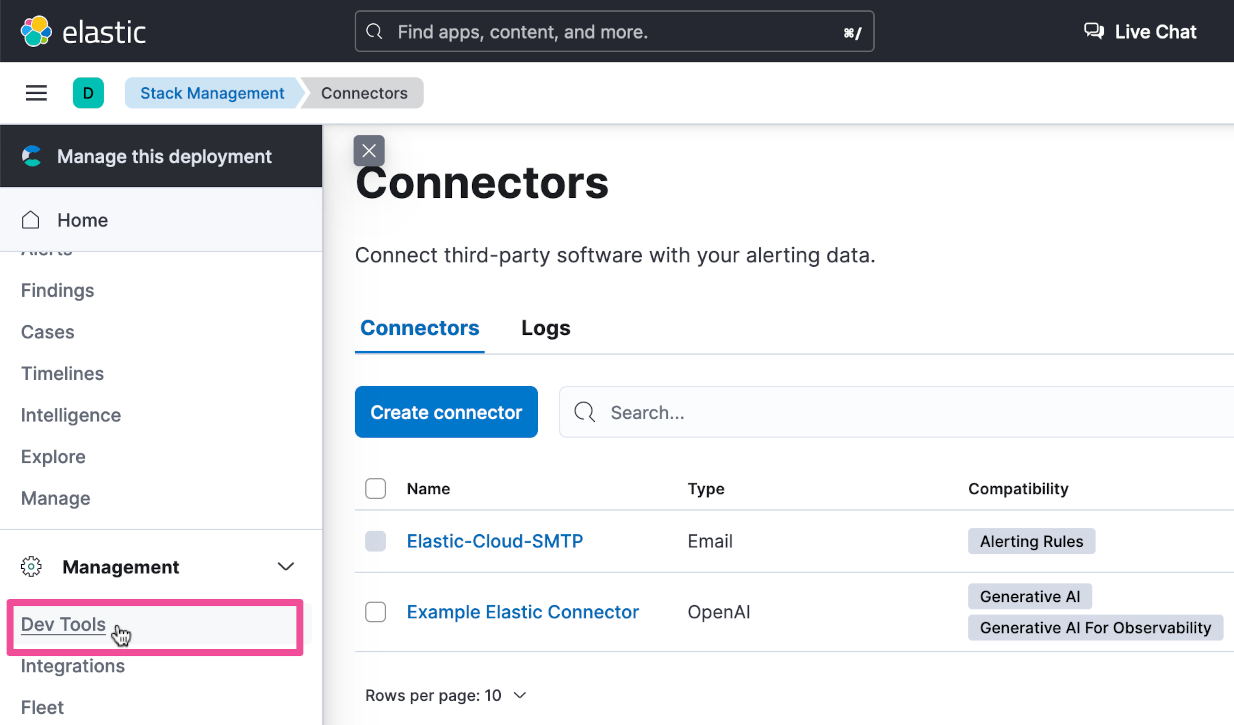
Within the Console area of Dev Tools, enter the following POST statement:
POST /logs-elastic_agent-default/_doc
{
	"message": "Status(StatusCode=\"FailedPrecondition\", Detail=\"Can't access cart storage. \nSystem.ApplicationException: Wasn't able to connect to redis \n  at cartservice.cartstore.RedisCartStore.EnsureRedisConnected() in /usr/src/app/src/cartstore/RedisCartStore.cs:line 104 \n  at cartservice.cartstore.RedisCartStore.EmptyCartAsync(String userId) in /usr/src/app/src/cartstore/RedisCartStore.cs:line 168\").",
	"@timestamp": "2024-02-22T11:34:00.884Z",
	"log": {
    	"level": "error"
	},
	"service": {
    	"name": "cartService"
	},
	"host": {
    	"name": "appserver-1"
	}
}
Then run the POST command by clicking the green Run button.
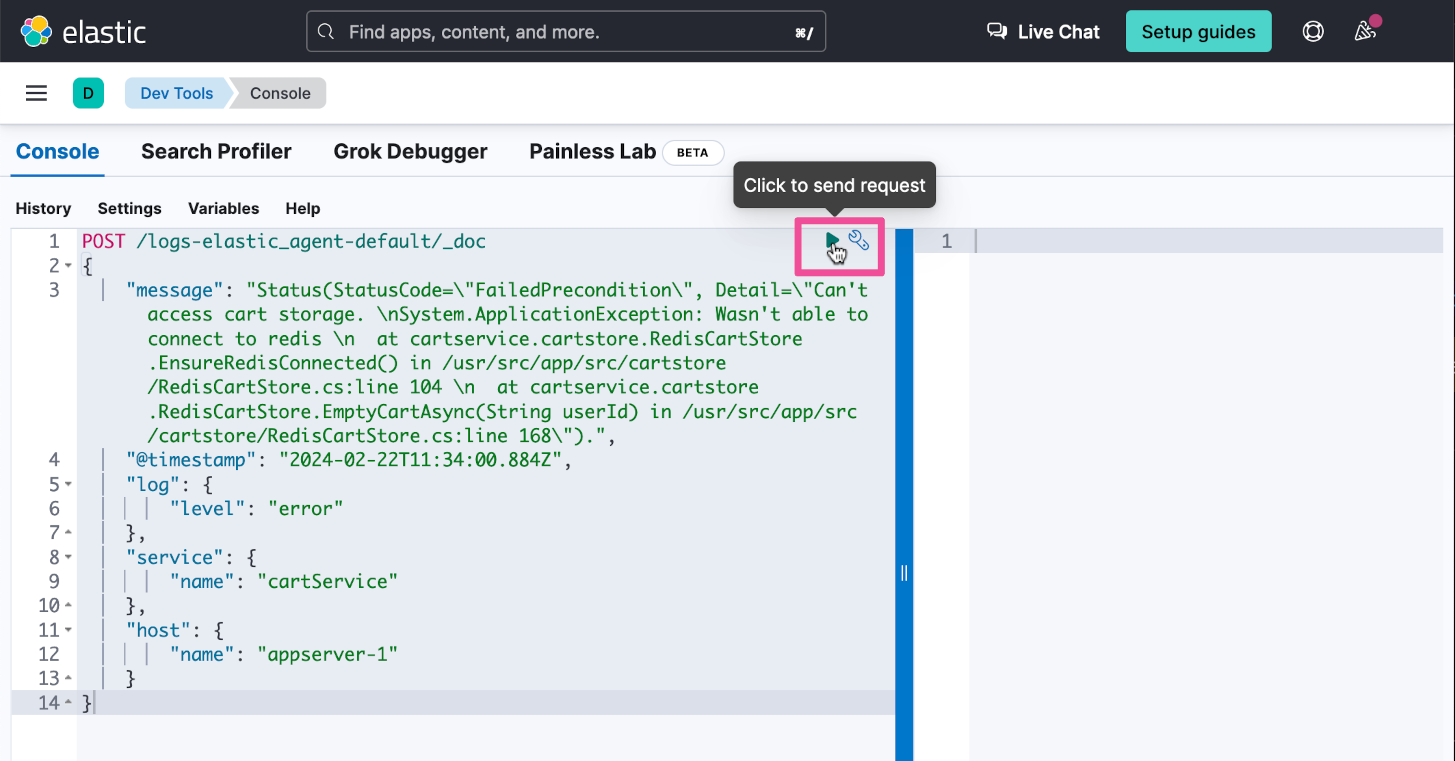
You should see a 201 response confirming that the example logs record was successfully created.
Use the Elastic AI Assistant
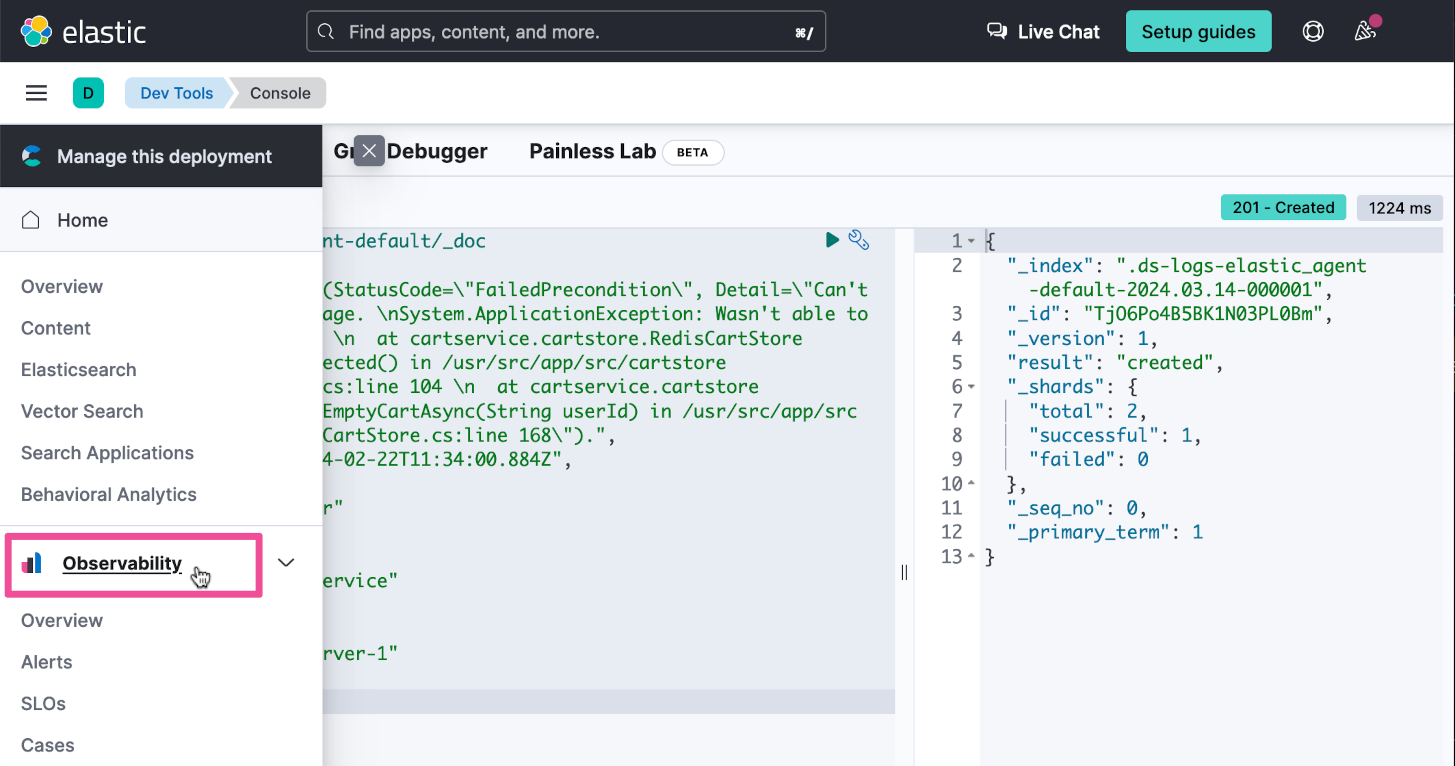
Now that you have a log record to work with, let’s jump over to the Observability Logs Explorer to see how the AI Assistant interacts with logs data. Click the top-level menu and select Observability.
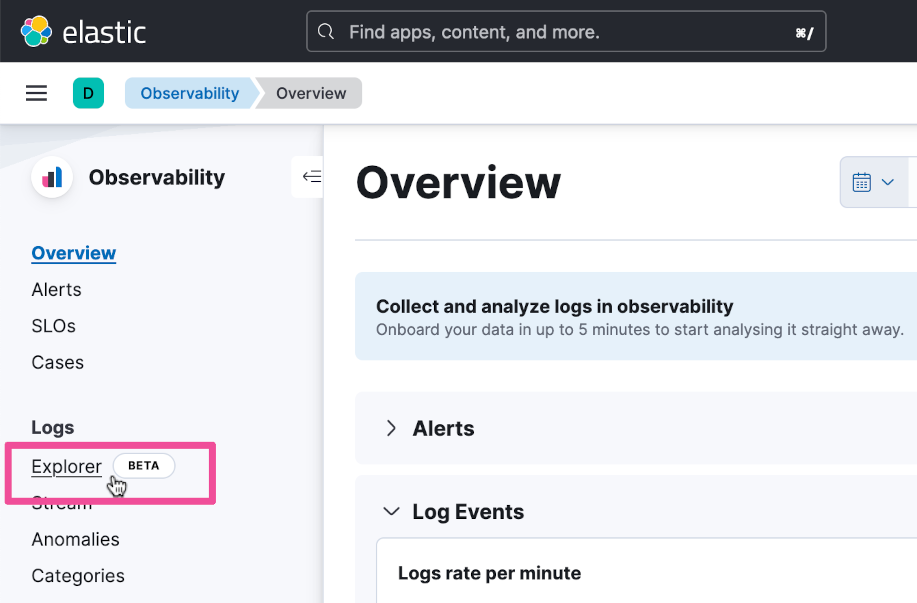
Select Logs Explorer to explore the logs data.
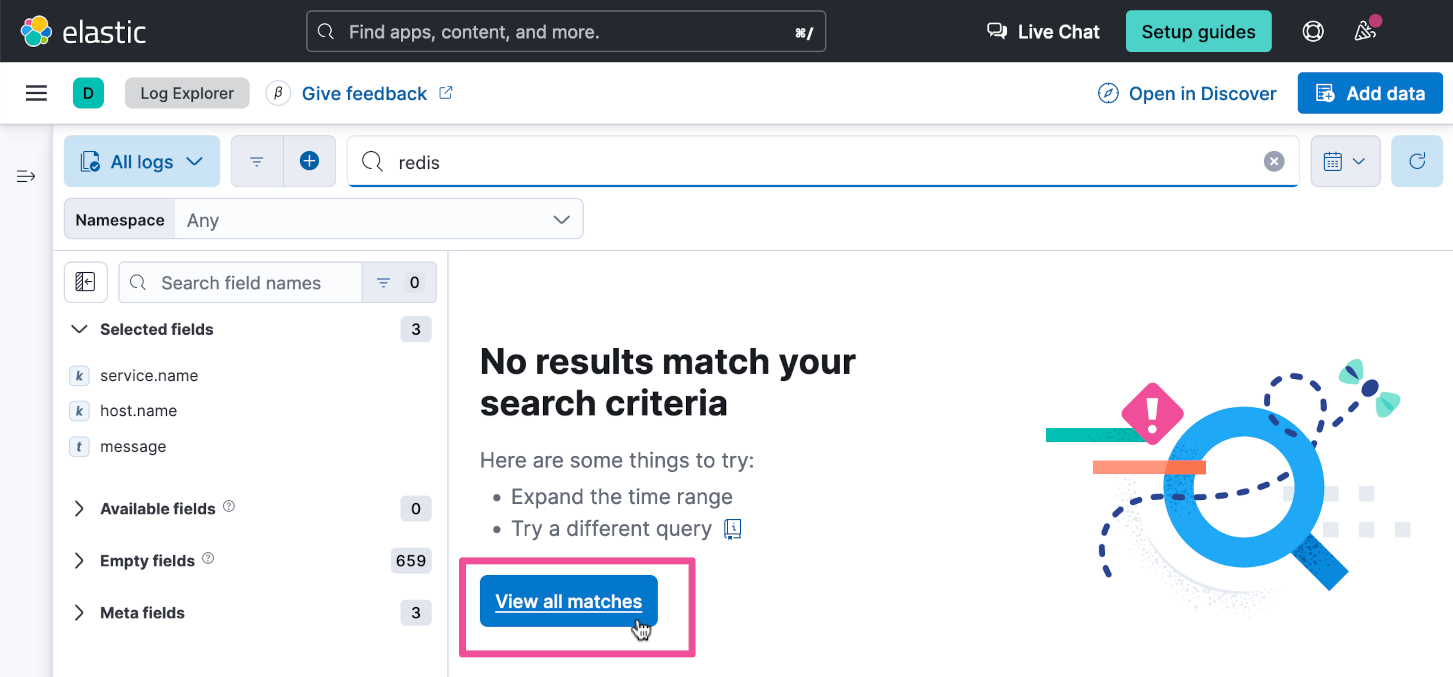
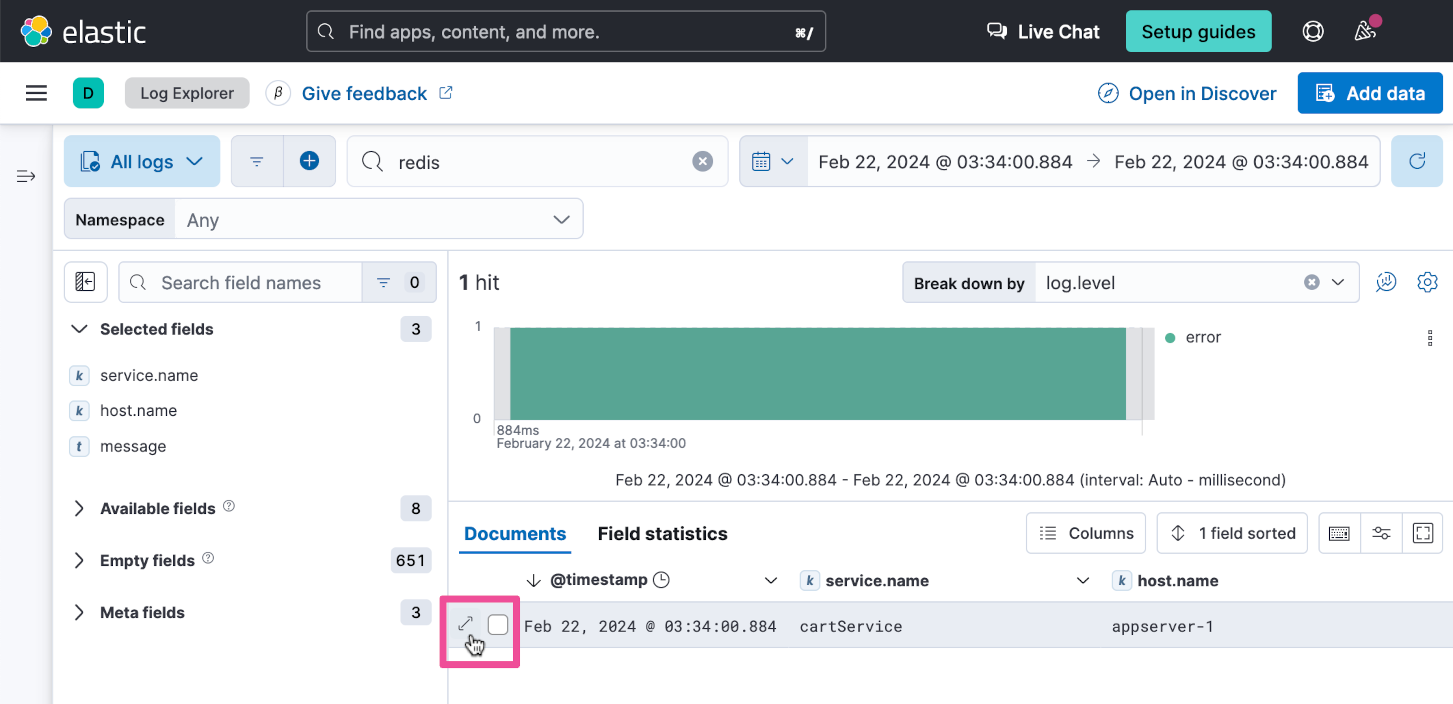
In the Logs Explorer search box, enter the text “redis” and press the Enter key to perform the search.

Click the View all matches button to include all search results.
You should see the one log record that you previously inserted via Dev Tools. Click the expand icon to see the log record’s details.
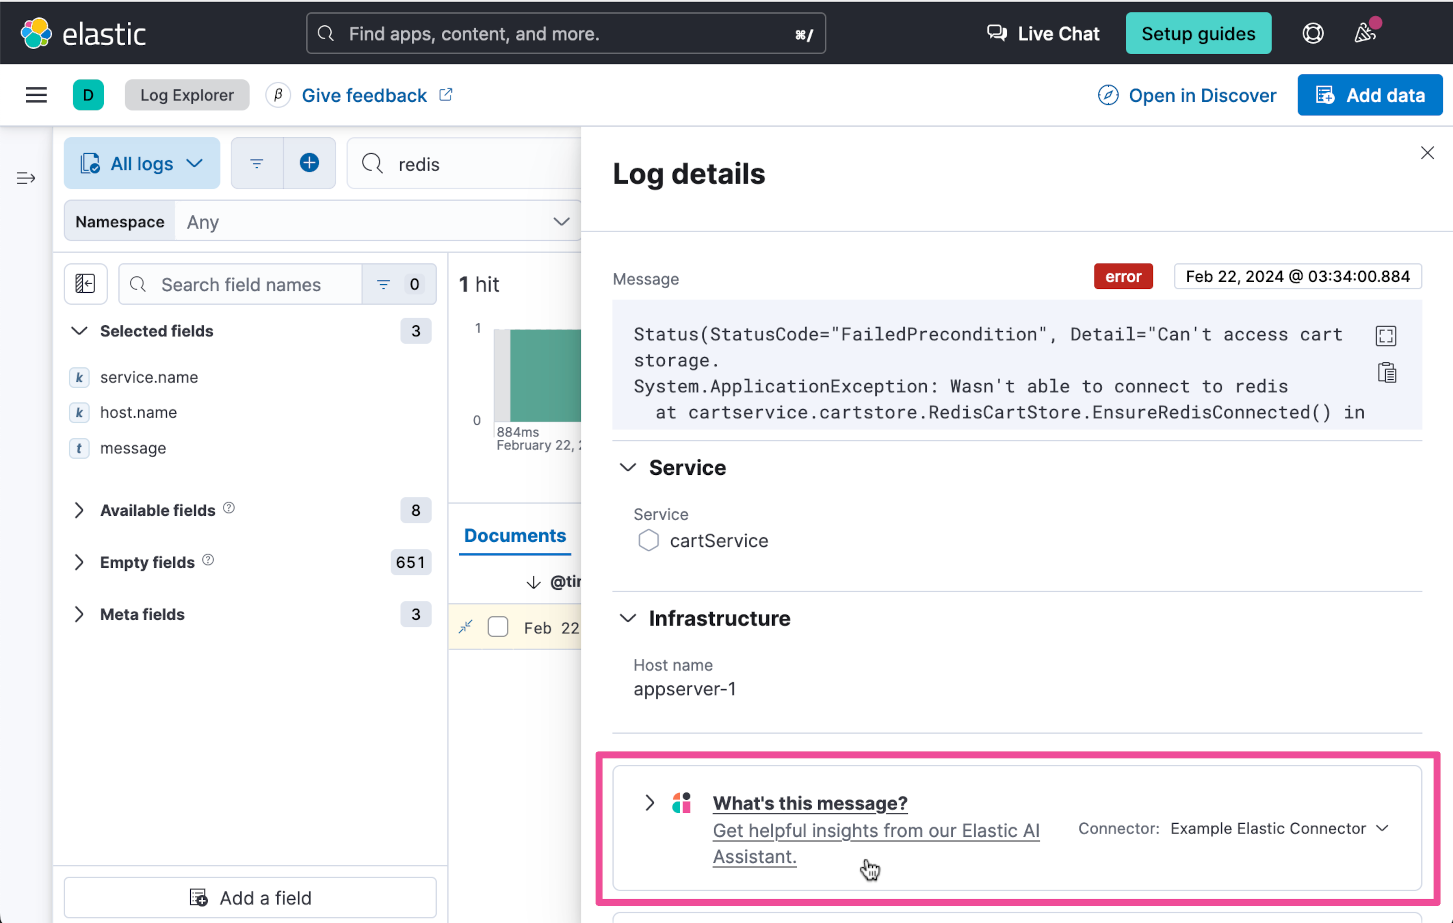
You should see the expanded view of the logs record. Instead of trying to understand its contents ourselves, we'll use the AI Assistant to summarize it. Click on the What's this message? button.
We get a fairly generic answer back. Depending on the exception or error we're trying to analyze, this can still be really useful, but we can make this better by adding additional documentation to the AI Assistant knowledge base.
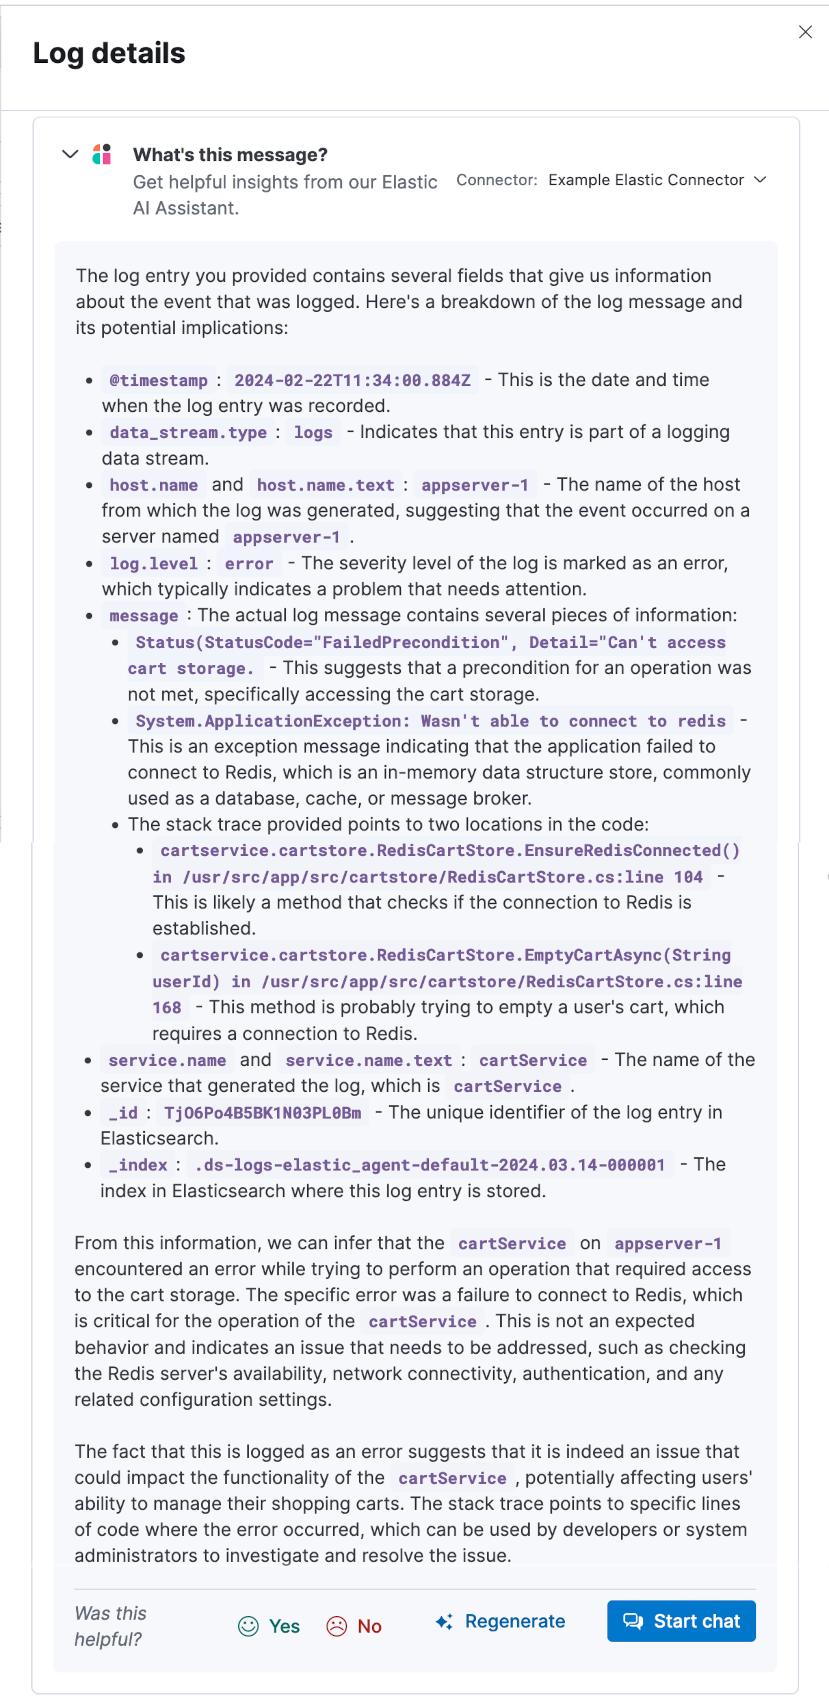
Let’s see how we can use the AI Assistant’s knowledge base to improve its understanding of this specific logs message.
Create an Elastic AI Assistant knowledge base
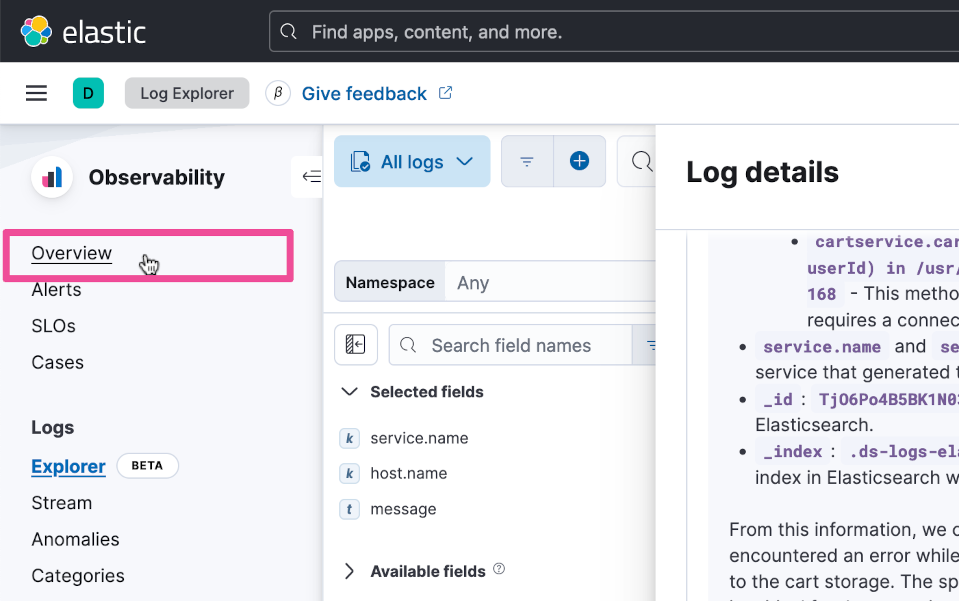
Select Overview from the Observability menu.
Click the AI Assistant button at the top right of the window.

Click the Install Knowledge base button.
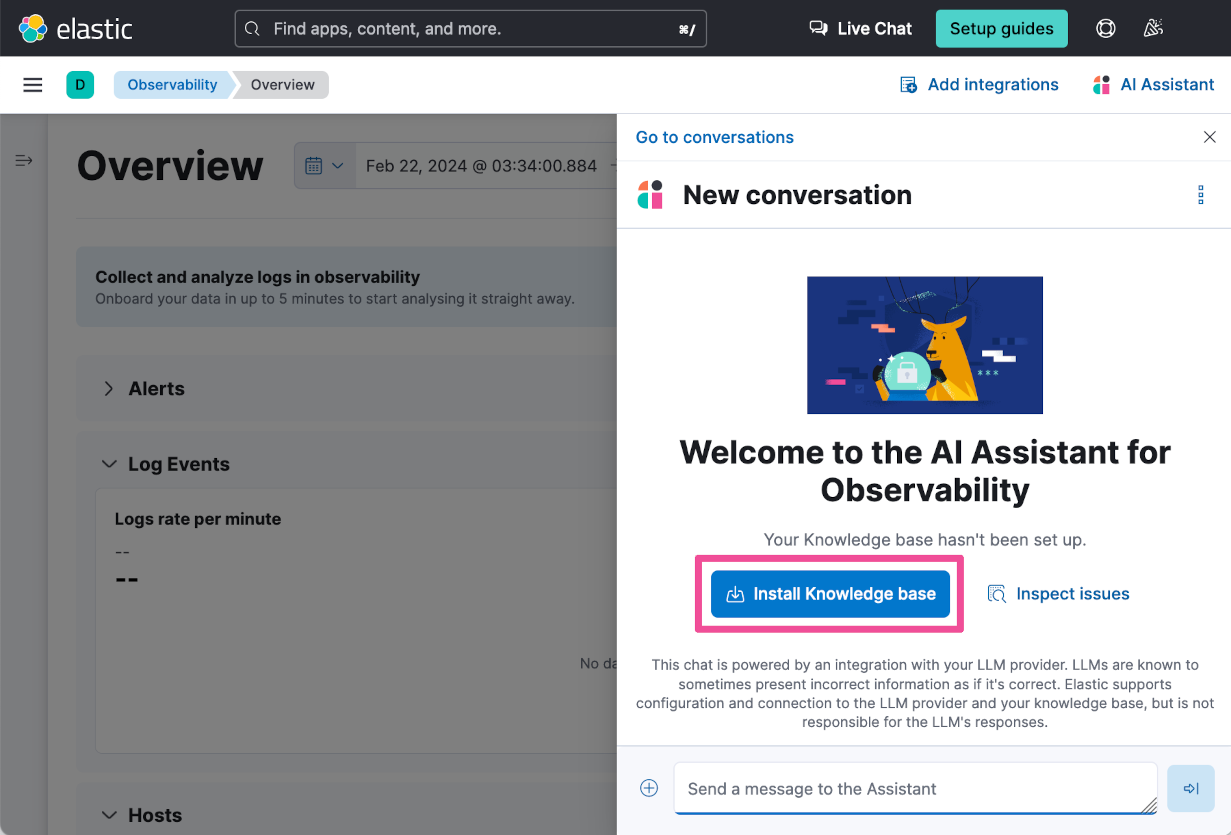
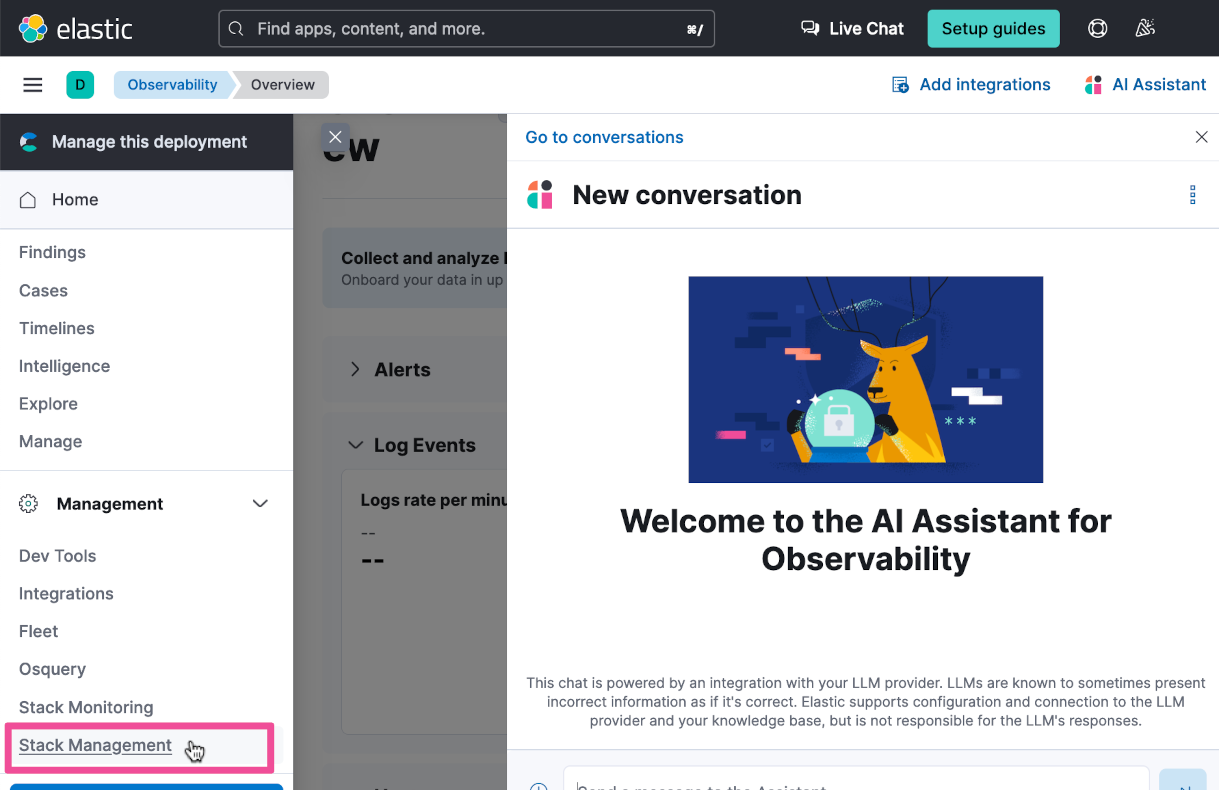
Click the top-level menu and select Stack Management.
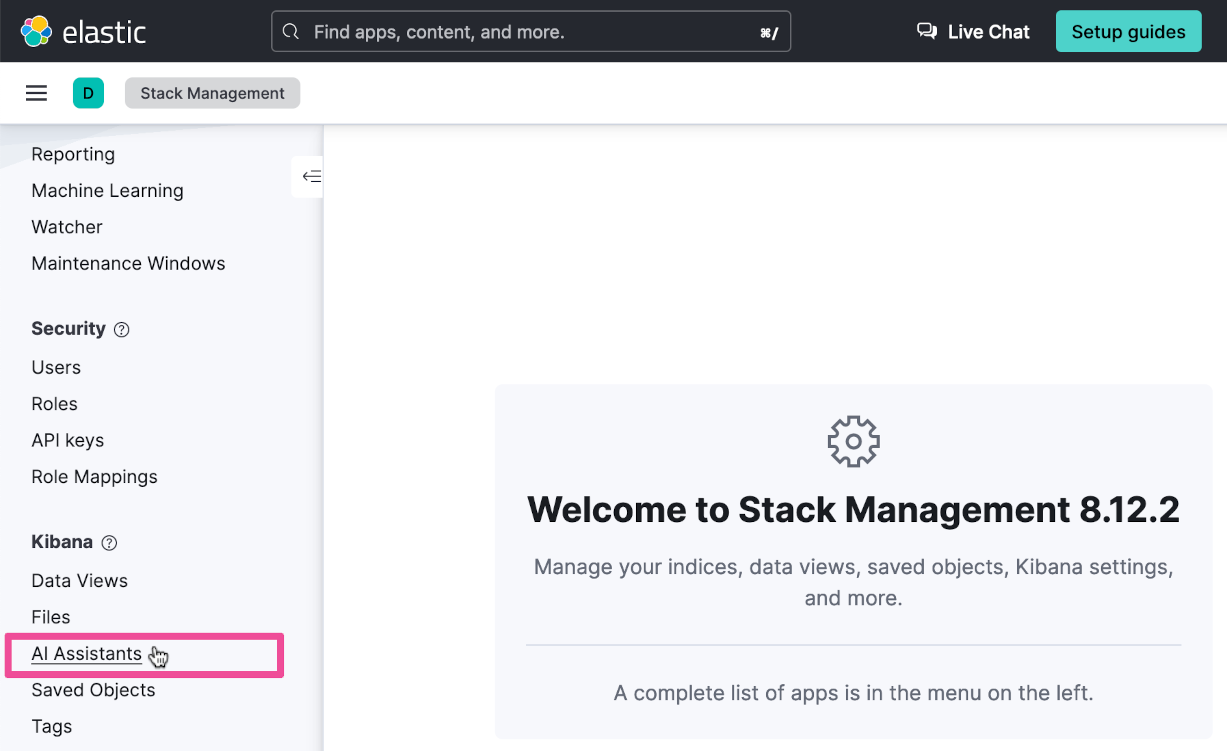
Then select AI Assistants.
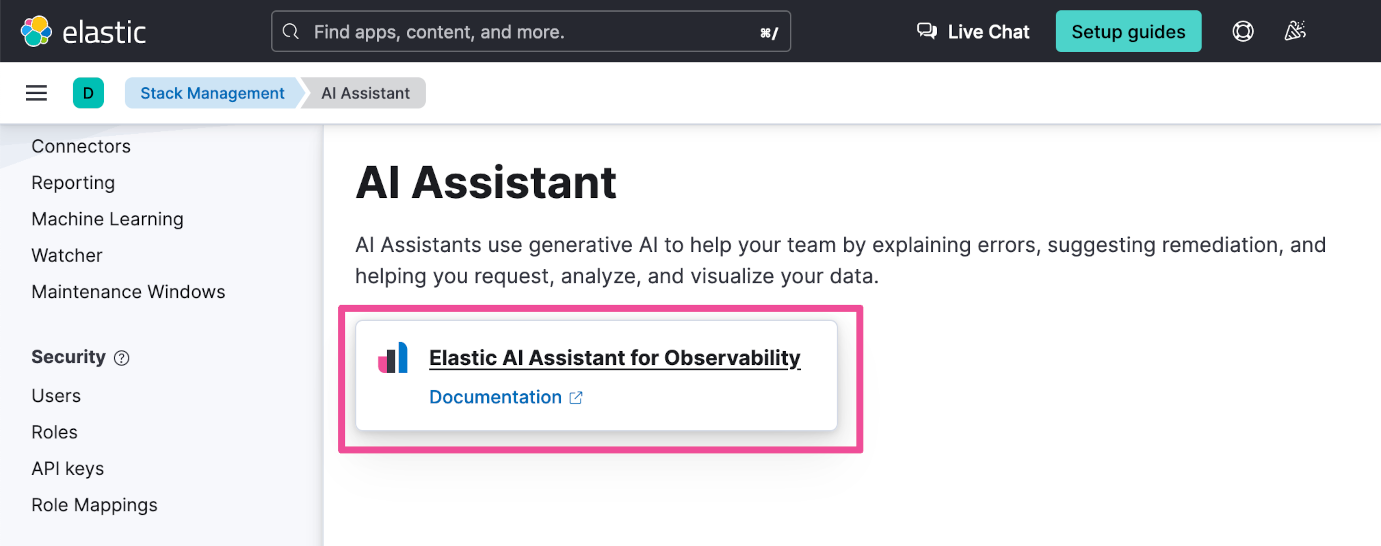
Click Elastic AI Assistant for Observability.
Select the Knowledge base tab.
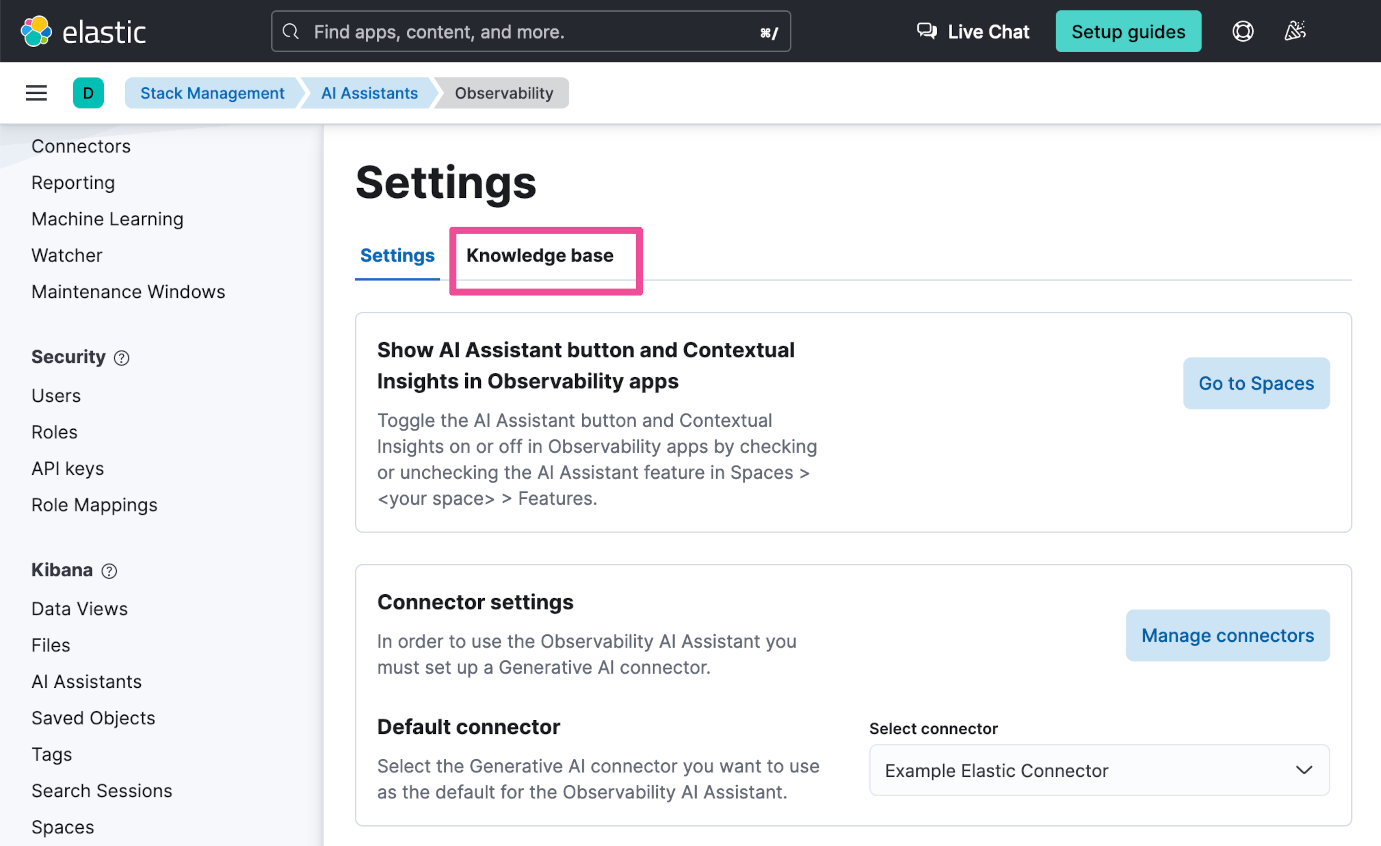
Click the New entry button and select Single entry.
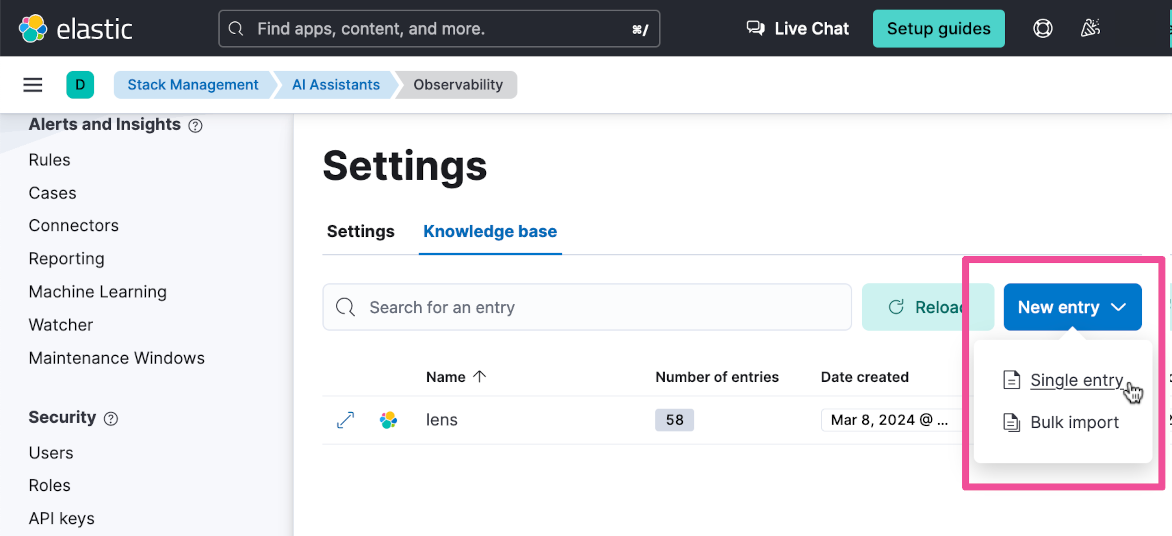
Give it the Name “cartservice” and enter the following text as the Contents:
I have the following GitHub issue. Store this information in your knowledge base and always return the link to it if relevant.
GitHub Issue, return if relevant

Link: https://github.com/elastic/observability-examples/issues/25

Title: Cartservice Intermittent connection issue

Body:
The cartservice occasionally encounters storage errors due to an unreliable network connection.

The errors typically indicate a failure to connect to Redis, as seen in the error message:

Status(StatusCode="FailedPrecondition", Detail="Can't access cart storage.
System.ApplicationException: Wasn't able to connect to redis
  at cartservice.cartstore.RedisCartStore.EnsureRedisConnected() in /usr/src/app/src/cartstore/RedisCartStore.cs:line 104
  at cartservice.cartstore.RedisCartStore.EmptyCartAsync(String userId) in /usr/src/app/src/cartstore/RedisCartStore.cs:line 168')'.
I just talked to the SRE team in Slack, they have plans to implement retries as a quick fix and address the network issue later.
Click Save to save the new knowledge base entry.
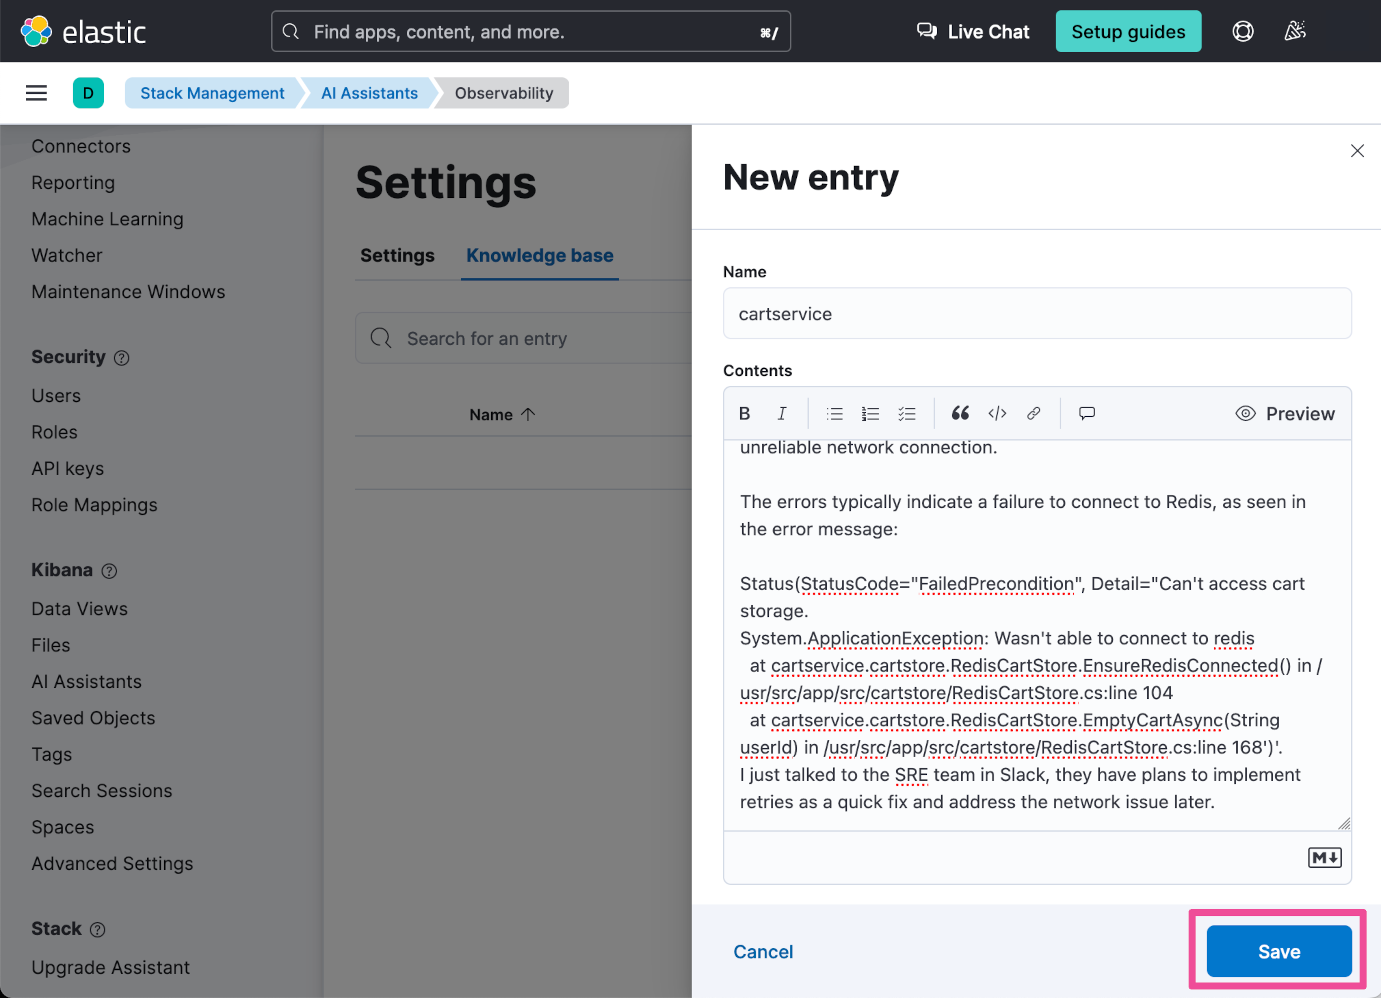
Now let’s go back to the Observability Logs Explorer. Click the top-level menu and select Observability.
Then select Explorer under Logs.
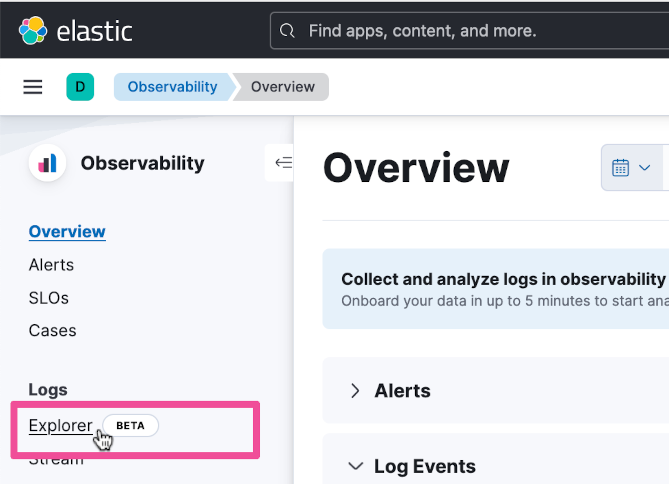
Expand the same logs entry as you did previously and click the What’s this message? button.
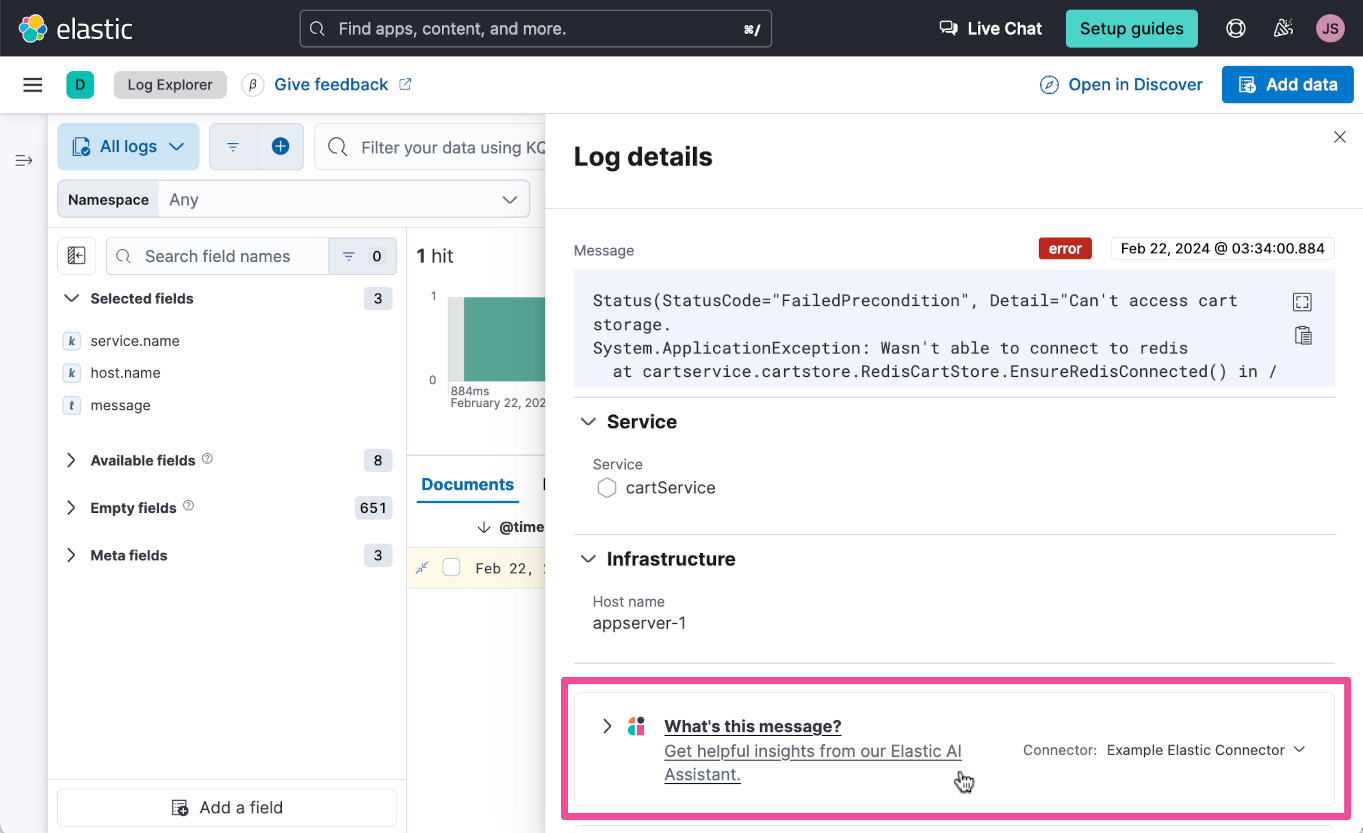
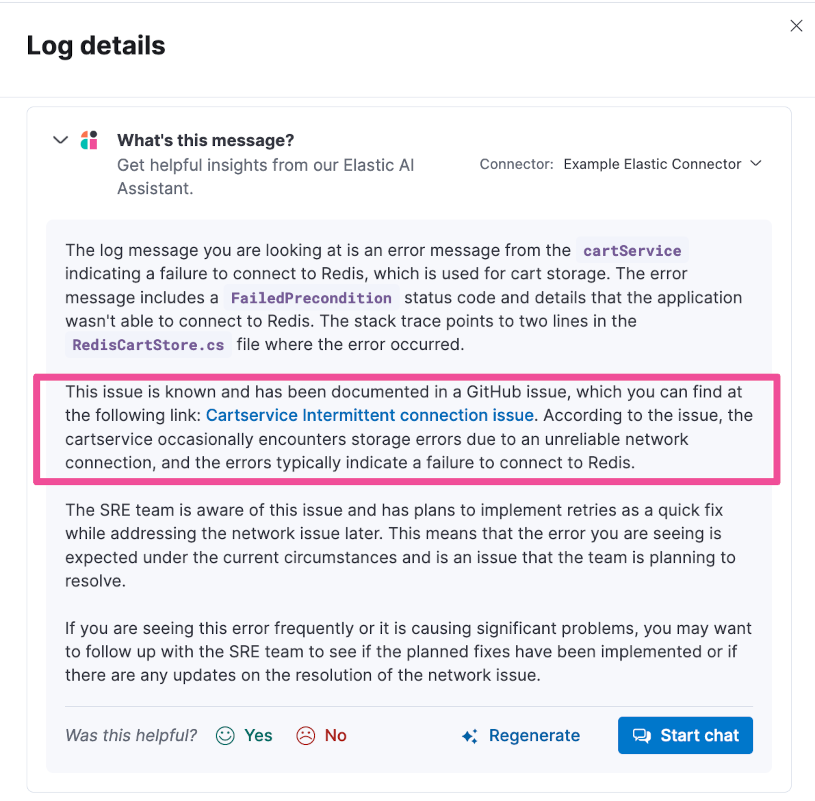
The response you get now should be much more relevant.
Try out the Elastic AI Assistant with a knowledge base filled with your own data
Now that you’ve seen how easy it is to set up the Elastic AI Assistant for Observability, go ahead and give it a try for yourself. Sign up for a free 14-day trial. You can quickly spin up an Elastic Cloud deployment in minutes and have your own search powered AI knowledge base to help you with getting your most important work done.
The release and timing of any features or functionality described in this post remain at Elastic's sole discretion. Any features or functionality not currently available may not be delivered on time or at all.
In this blog post, we may have used or referred to third party generative AI tools, which are owned and operated by their respective owners. Elastic does not have any control over the third party tools and we have no responsibility or liability for their content, operation or use, nor for any loss or damage that may arise from your use of such tools. Please exercise caution when using AI tools with personal, sensitive or confidential information. Any data you submit may be used for AI training or other purposes. There is no guarantee that information you provide will be kept secure or confidential. You should familiarize yourself with the privacy practices and terms of use of any generative AI tools prior to use.
Elastic, Elasticsearch, ESRE, Elasticsearch Relevance Engine and associated marks are trademarks, logos or registered trademarks of Elasticsearch N.V. in the United States and other countries. All other company and product names are trademarks, logos or registered trademarks of their respective owners.
