Elastic Universal Profiling: Delivering performance improvements and reduced costs

In today's age of cloud services and SaaS platforms, continuous improvement isn't just a goal — it's a necessity. Here at Elastic, we're always on the lookout for ways to fine-tune our systems, be it our internal tools or the Elastic Cloud service. Our recent investigation in performance optimization within our Elastic Cloud QA environment, guided by Elastic Universal Profiling, is a great example of how we turn data into actionable insights.
In this blog, we’ll cover how a discovery by one of our engineers led to savings of thousands of dollars in our QA environment and magnitudes more once we deployed this change to production.
Elastic Universal Profiling: Our go-to tool for optimization
In our suite of solutions for addressing performance challenges, Elastic Universal Profiling is a critical component. As an “always-on” profiler utilizing eBPF, it integrates seamlessly into our infrastructure and systematically collects comprehensive profiling data across the entirety of our system. Because there is zero-code instrumentation or reconfiguration, it’s easy to deploy on any host (including Kubernetes hosts) in our cloud — we’ve deployed it across our environment for Elastic Cloud.
All of our hosts run the profiling agent to collect this data, which gives us detailed insight into the performance of any service that we’re running.
Spotting the opportunity
It all started with what seemed like a routine check of our QA environment. One of our engineers was looking through the profiling data. With Universal Profiling in play, this initial discovery was relatively quick. We found a function that was not optimized and had heavy compute costs.
Let’s go through it step-by-step.
In order to spot expensive functions, we can simply view a list of the TopN functions. The TopN functions list shows us all functions in all services we run that use the most CPU.
To sort them by their impact, we sort descending on the “total CPU”:
Self CPU measures the CPU time that a function directly uses, not including the time spent in functions it calls. This metric helps identify functions that use a lot of CPU power on their own. By improving these functions, we can make them run faster and use less CPU.
- Total CPU adds up the CPU time used by the function and any functions it calls. This gives a complete picture of how much CPU a function and its related operations use. If a function has a high "total CPU" usage, it might be because it's calling other functions that use a lot of CPU.
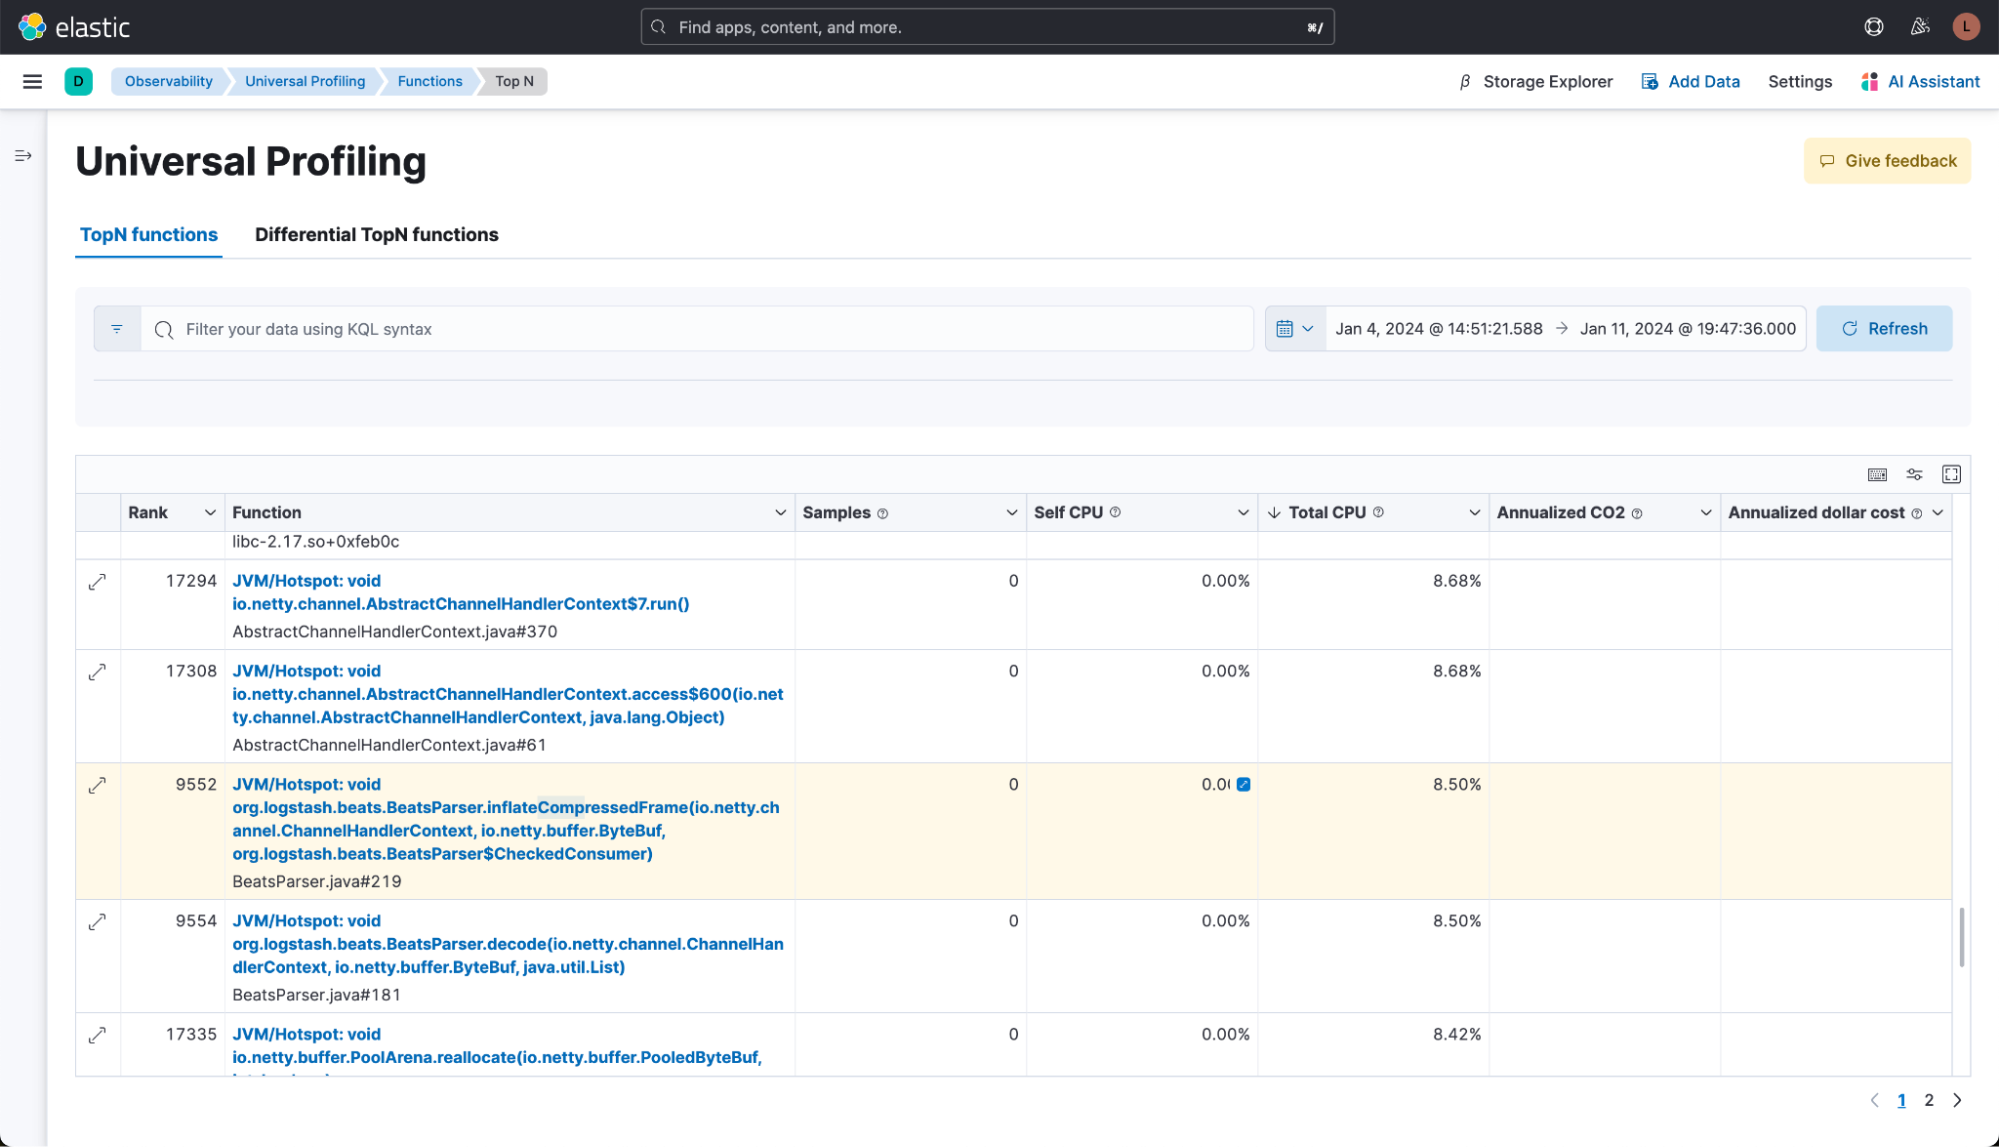
When our engineer reviewed the TopN functions list, one function called "...inflateCompressedFrame…" caught their attention. This is a common scenario where certain types of functions frequently become optimization targets. Here’s a simplified guide on what to look for and possible improvements:
Compression/decompression: Is there a more efficient algorithm? For example, switching from zlib to zlib-ng might offer better performance.
Cryptographic hashing algorithms: Ensure the fastest algorithm is in use. Sometimes, a quicker non-cryptographic algorithm could be suitable, depending on the security requirements.
Non-cryptographic hashing algorithms: Check if you're using the quickest option. xxh3, for instance, is often faster than other hashing algorithms.
Garbage collection: Minimize heap allocations, especially in frequently used paths. Opt for data structures that don't rely on garbage collection.
Heap memory allocations: These are typically resource-intensive. Consider alternatives like using jemalloc or mimalloc instead of the standard libc malloc() to reduce their impact.
Page faults: Keep an eye out for "exc_page_fault" in your TopN Functions or flamegraph. They indicate areas where memory access patterns could be optimized.
Excessive CPU usage by kernel functions: This may indicate too many system calls. Using larger buffers for read/write operations can reduce the number of syscalls.
Serialization/deserialization: Processes like JSON encoding or decoding can often be accelerated by switching to a faster JSON library.
Identifying these areas can help in pinpointing where performance can be notably improved.
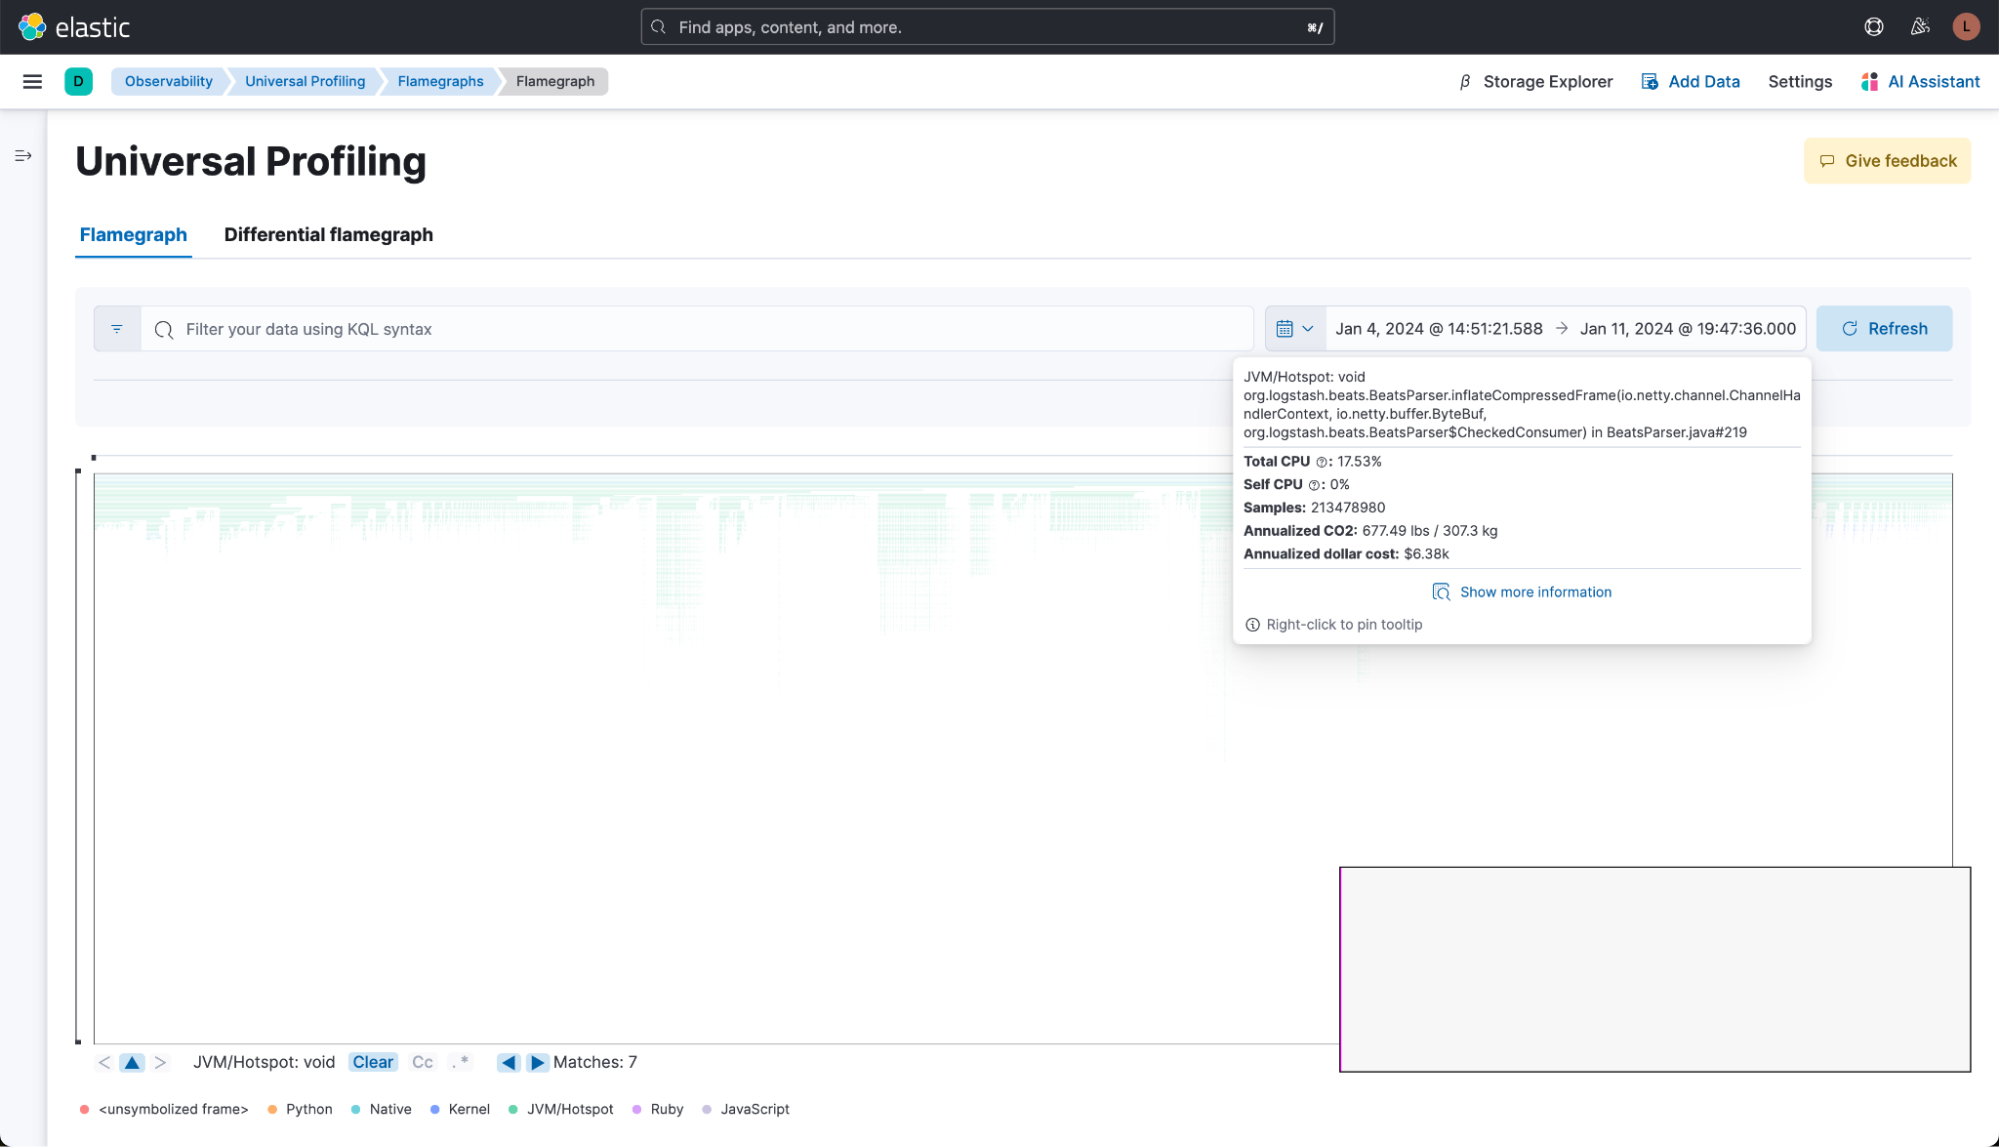
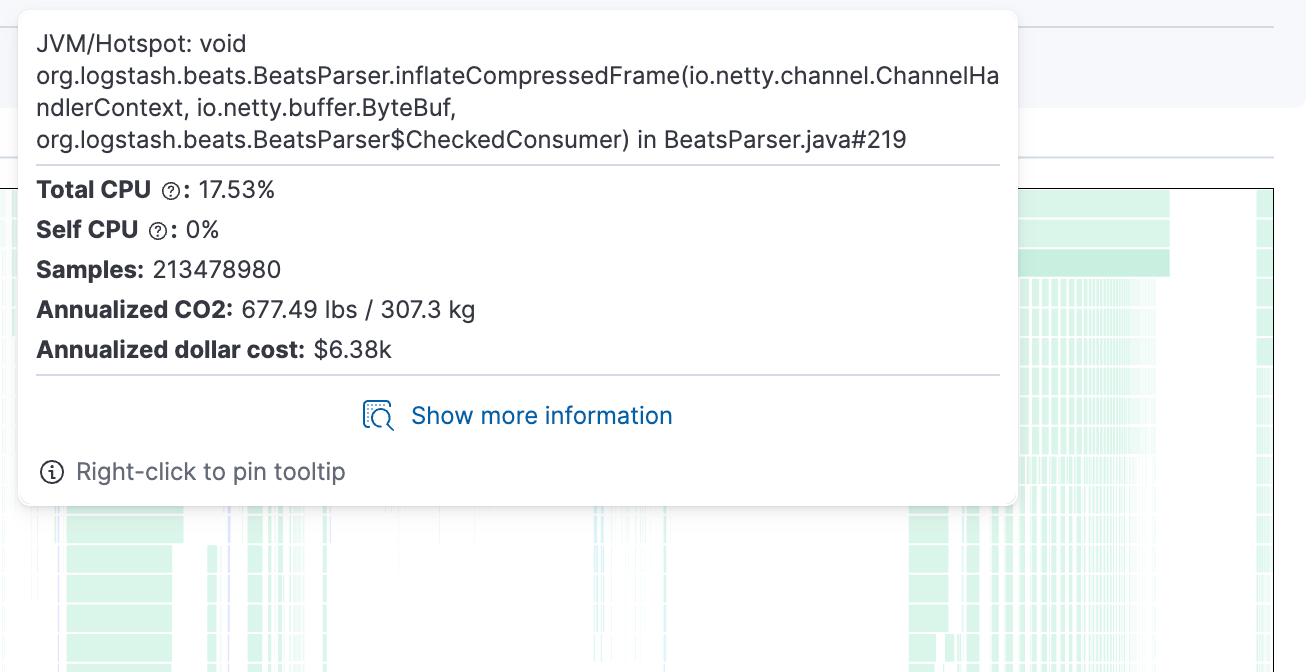
Clicking on the function from the TopN view shows it in the flamegraph. Note that the flamegraph is showing the samples from the full cloud QA infrastructure. In this view, we can tell that this function alone was accounting for >US$6,000 annualized in this part of our QA environment.
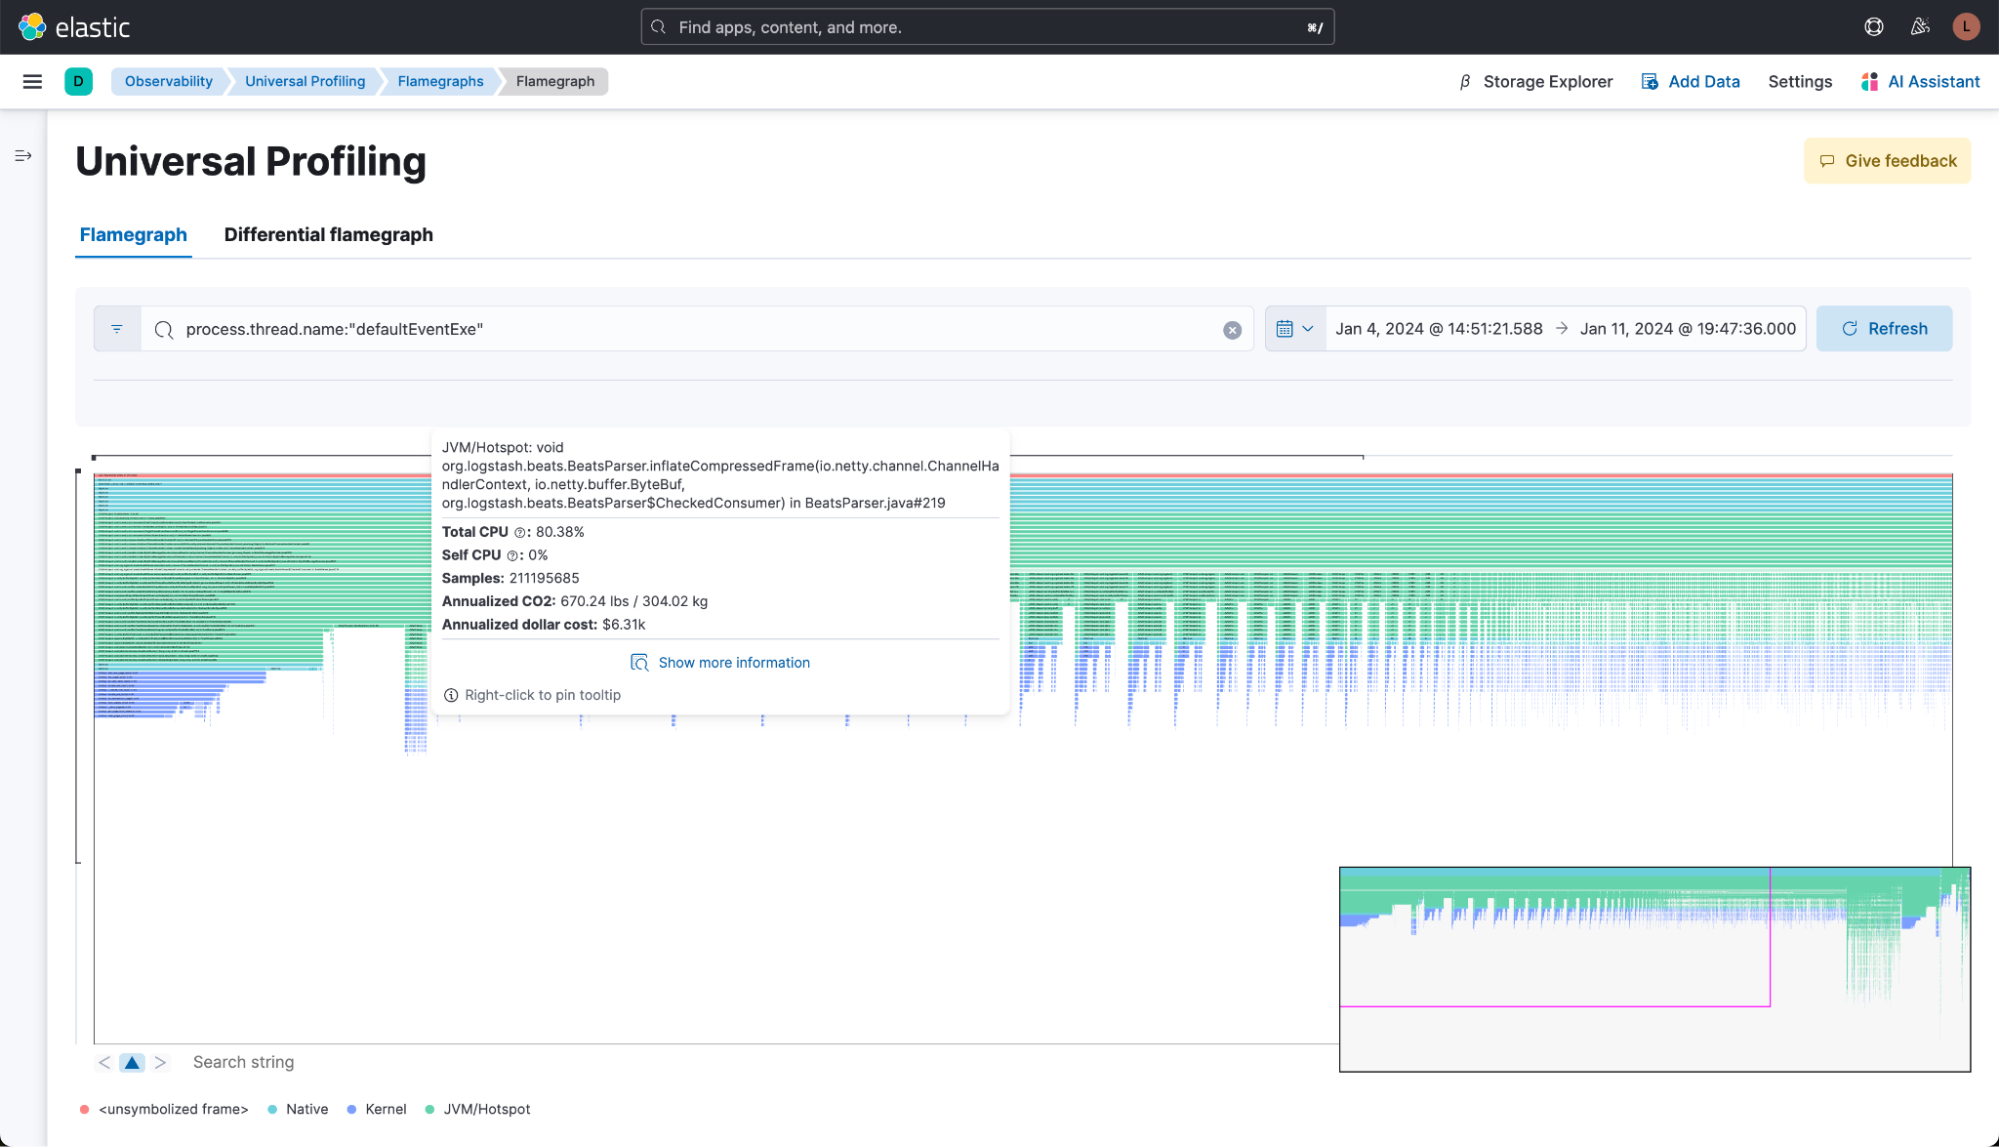
After filtering for the thread, it became more clear what the function was doing. The following image shows a flamegraph of this thread across all of the hosts running in the QA environment.
Instead of looking at the thread across all hosts, we can also look at a flamegraph for just one specific host.
If we look at this one host at a time, we can see that the impact is even more severe. Keep in mind that the 17% from before was for the full infrastructure. Some hosts may not even be running this service and therefore bring down the average.
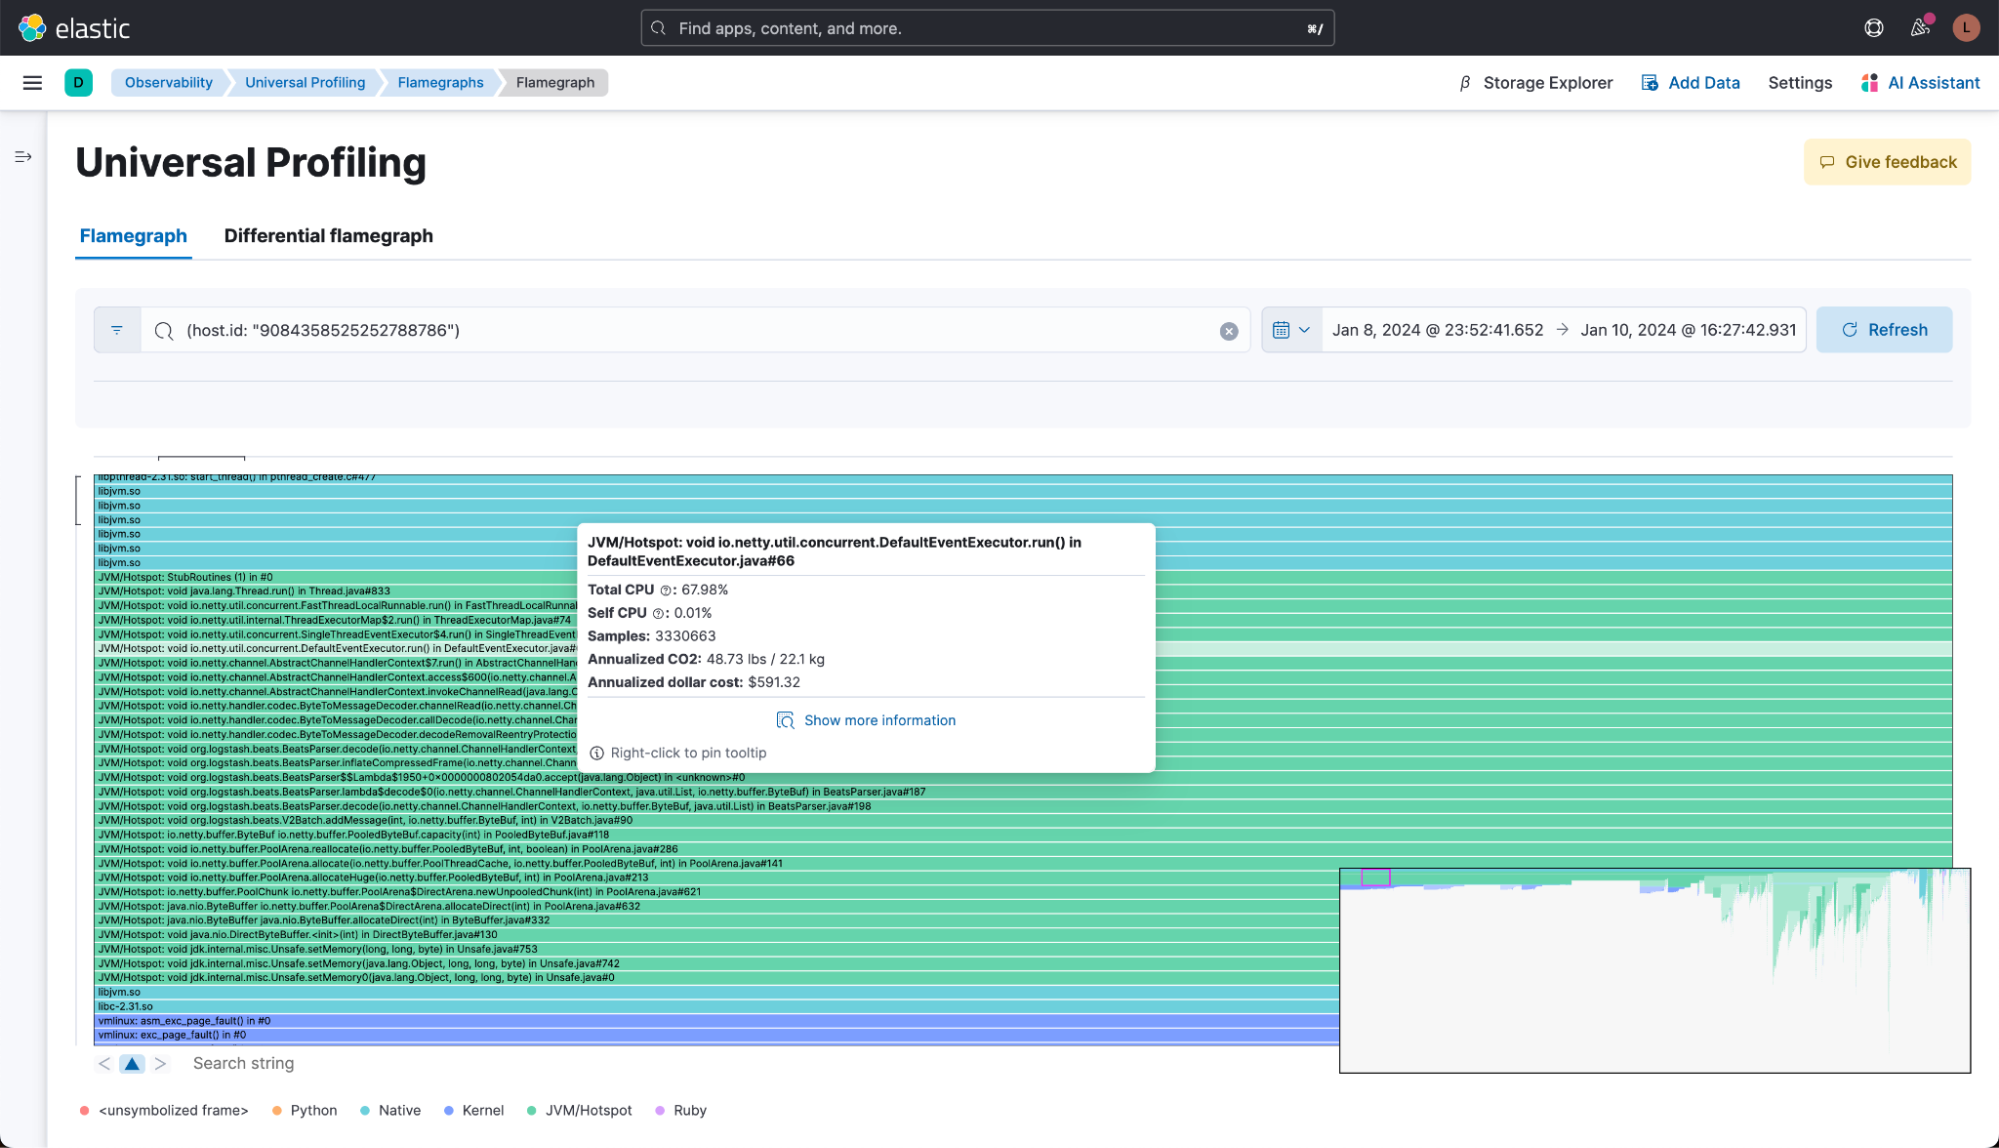
Filtering things down to a single host that has the service running, we can tell that this host is actually spending close to 70% of its CPU cycles on running this function.
The dollar cost here just for this one host would put the function at around US$600 per year.
Understanding the performance problem
After identifying a potentially resource-intensive function, our next step involved collaborating with our Engineering teams to understand the function and work on a potential fix. Here's a straightforward breakdown of our approach:
- Understanding the function: We began by analyzing what the function should do. It utilizes gzip for decompression. This insight led us to briefly consider strategies mentioned earlier for reducing CPU usage, such as using a more efficient compression library like zlib or switching to zstd compression.
- Evaluating the current implementation: The function currently relies on JDK's gzip decompression, which is expected to use native libraries under the hood. Our usual preference is Java or Ruby libraries when available because they simplify deployment. Opting for a native library directly would require us to manage different native versions for each OS and CPU we support, complicating our deployment process.
- Detailed analysis using flamegraph: A closer examination of the flamegraph revealed that the system encounters page faults and spends significant CPU cycles handling these.
Let’s start with understanding the Flamegraph:
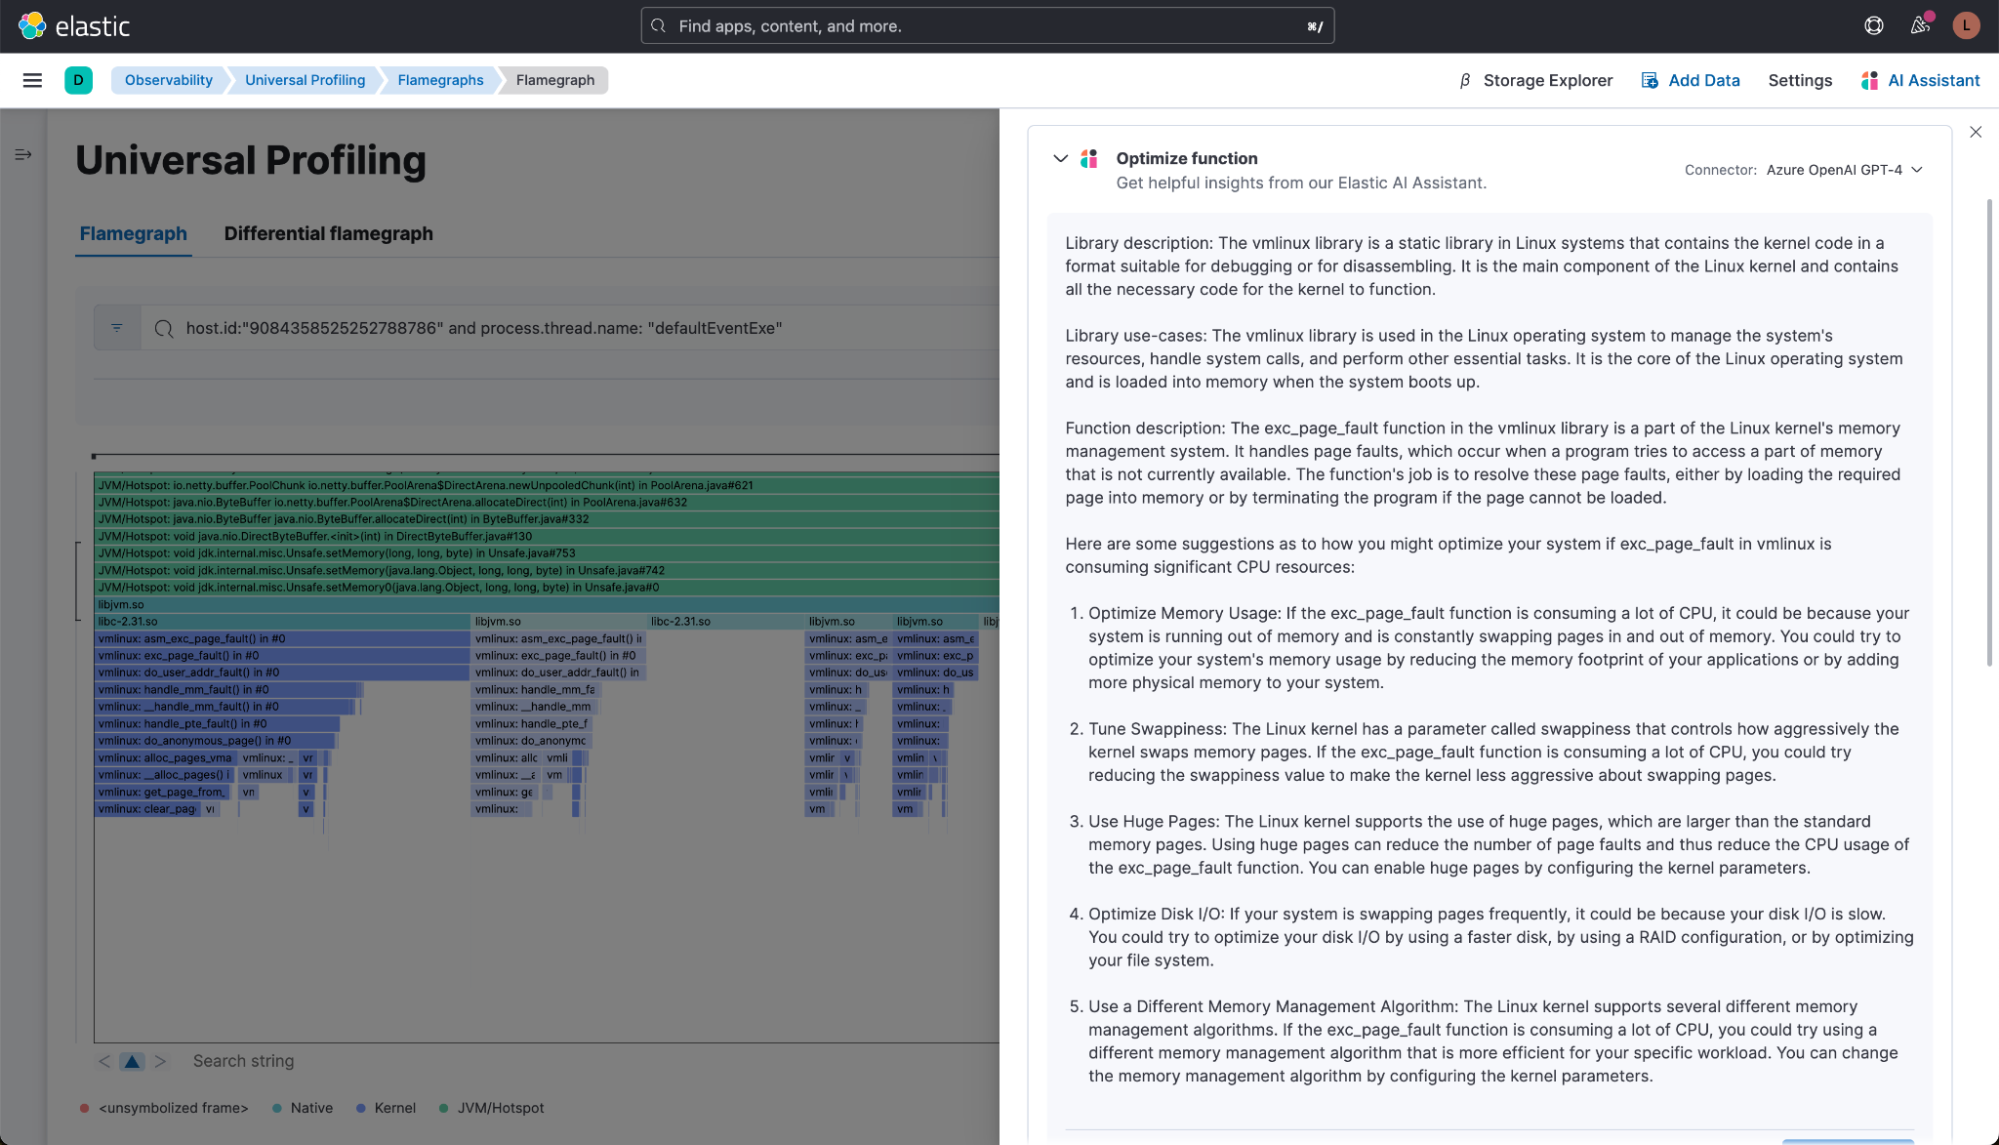
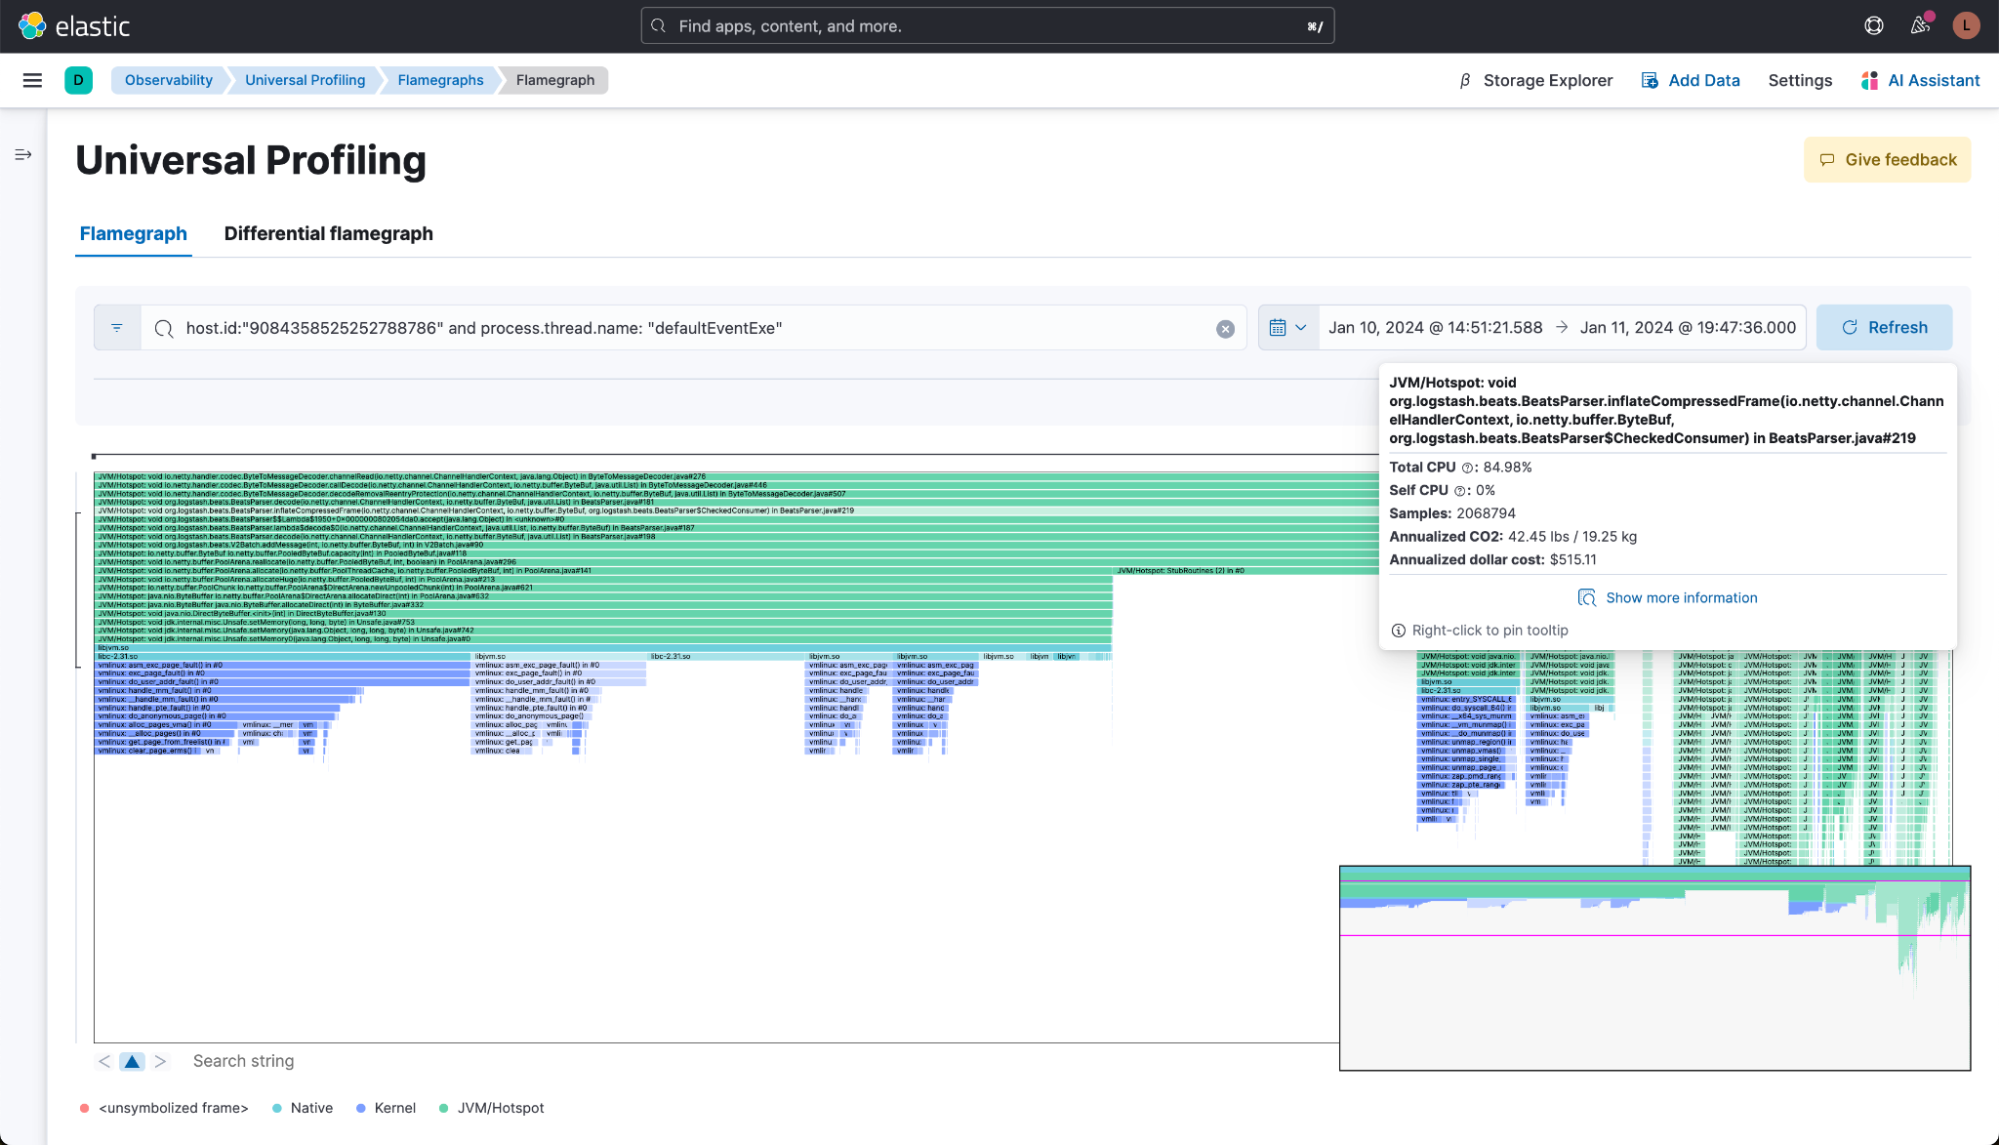
The last few non jdk.* JVM instructions (in green) show the allocation of a direct memory Byte Buffer started by Netty's DirectArena.newUnpooledChunk. Direct memory allocations are costly operations that typically should be avoided on an application's critical path.
The Elastic AI Assistant for Observability is also useful in understanding and optimizing parts of the flamegraph. Especially for users new to Universal Profiling, it can add lots of context to the collected data and give the user a better understanding of them and provide potential solutions.
Netty's memory allocation
Netty, a popular asynchronous event-driven network application framework, uses the maxOrder setting to determine the size of memory chunks allocated for managing objects within its applications. The formula for calculating the chunk size is chunkSize = pageSize << maxOrder. The default maxOrder value of either 9 or 11 results in the default memory chunk size being 4MB or 16MB, respectively, assuming a page size of 8KB.
Impact on memory allocation
Netty employs a PooledAllocator for efficient memory management, which allocates memory chunks in a pool of direct memory at startup. This allocator optimizes memory usage by reusing memory chunks for objects smaller than the defined chunk size. Any object that exceeds this threshold must be allocated outside of the PooledAllocator.
Allocating and releasing memory outside of this pooled context incurs a higher performance cost for several reasons:
- Increased allocation overhead: Objects larger than the chunk size require individual memory allocation requests. These allocations are more time-consuming and resource-intensive compared to the fast, pooled allocation mechanism for smaller objects.
- Fragmentation and garbage collection (GC) pressure: Allocating larger objects outside the pool can lead to increased memory fragmentation. Furthermore, if these objects are allocated on the heap, it can increase GC pressure, leading to potential pauses and reduced application performance.
- Netty and the Beats/Agent input: Logstash's Beats and Elastic Agent inputs use Netty to receive and send data. During processing of a received data batch, decompressing the data frame requires creating a buffer large enough to store the uncompressed events. If this batch is larger than the chunk size, an unpooled chunk is needed, causing a direct memory allocation that slows performance. The universal profiler allowed us to confirm that this was the case from the DirectArena.newUnpooledChunk calls in the flamegraph.
Fixing the performance problem in our environments
We decided to implement a quick workaround to test our hypothesis. Apart from having to adjust the jvm options once, this approach does not have any major downsides.
The immediate workaround involves manually adjusting the maxOrder setting back to its previous value. This can be achieved by adding a specific flag to the config/jvm.options file in Logstash:
-Dio.netty.allocator.maxOrder=11This adjustment will revert the default chunk size to 16MB (chunkSize = pageSize << maxOrder, or 16MB = 8KB << 11), which aligns with the previous behavior of Netty, thereby reducing the overhead associated with allocating and releasing larger objects outside of the PooledAllocator.
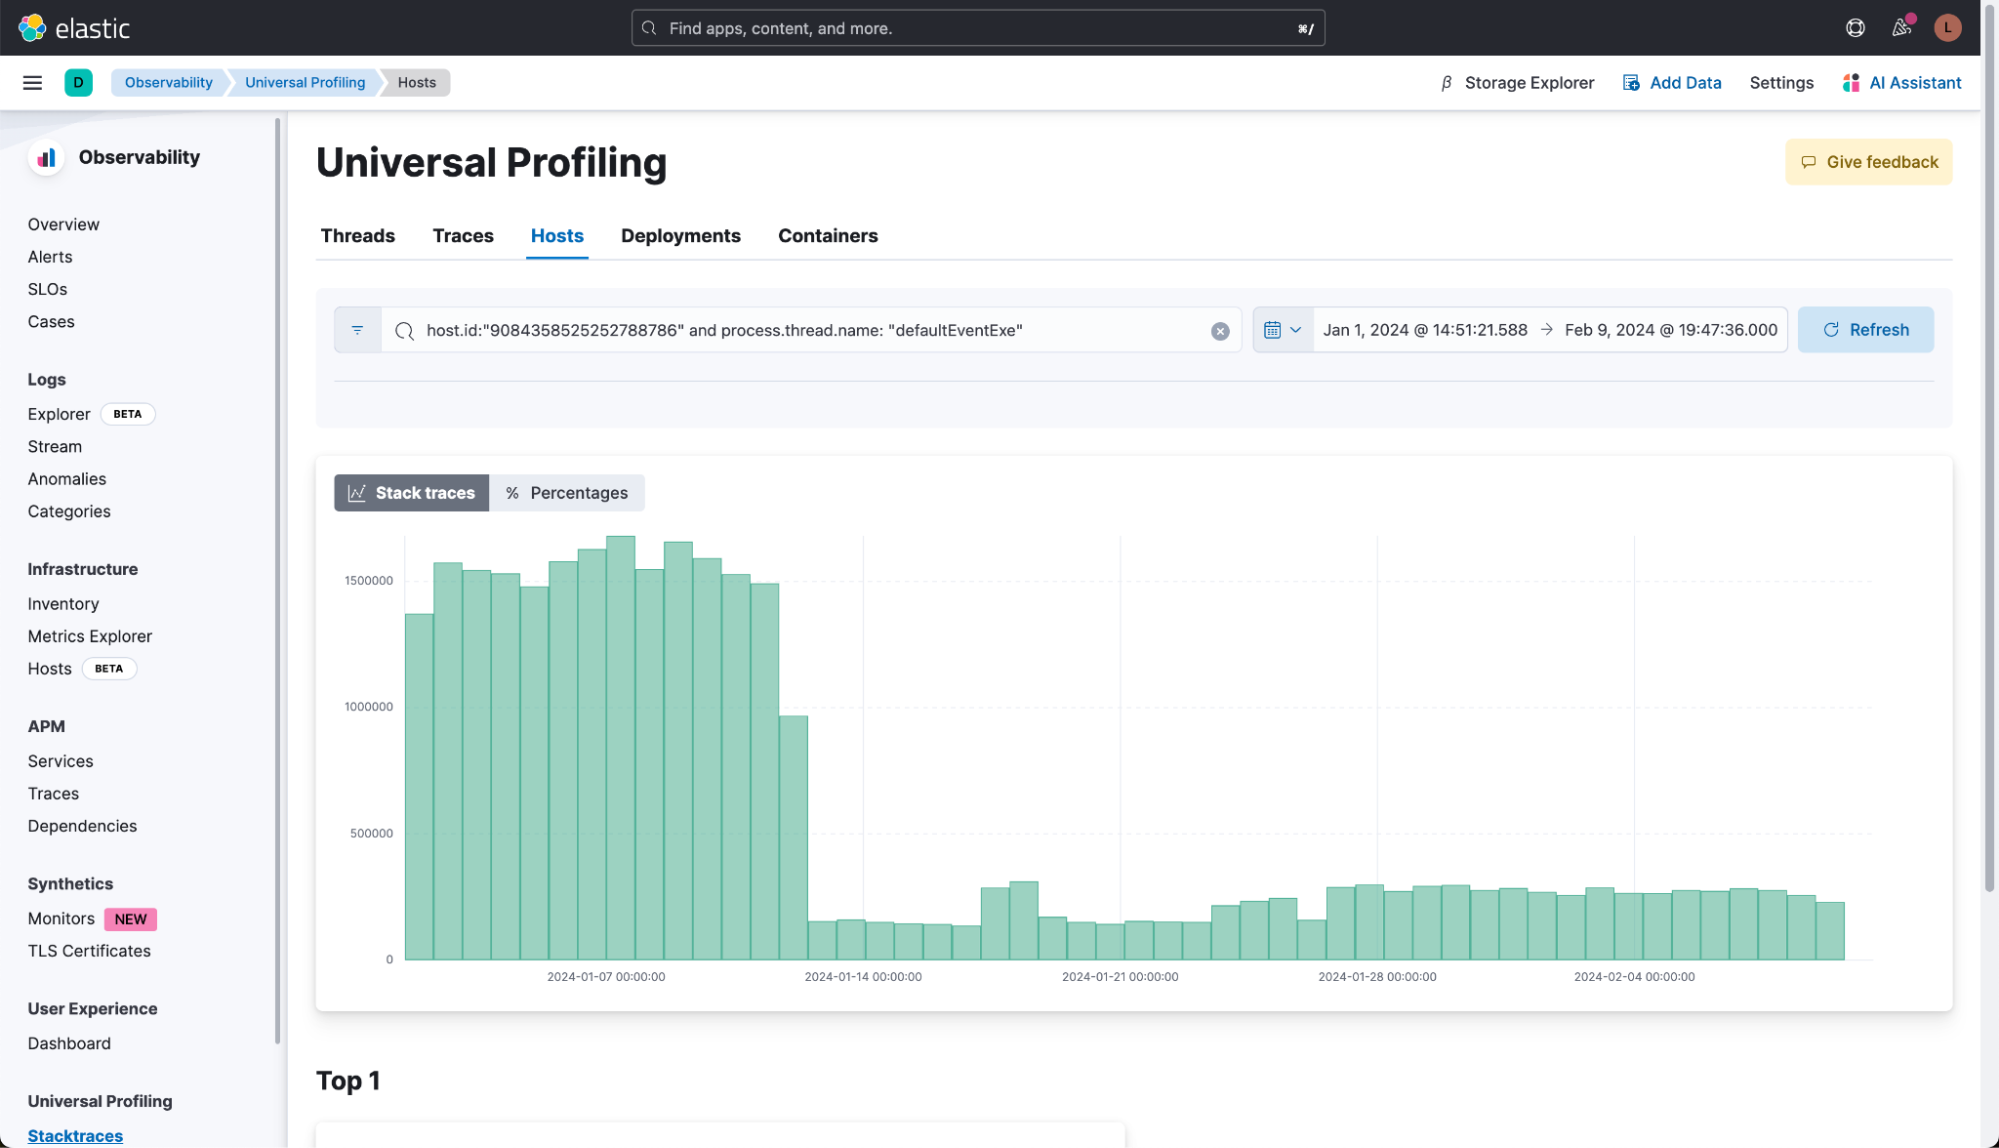
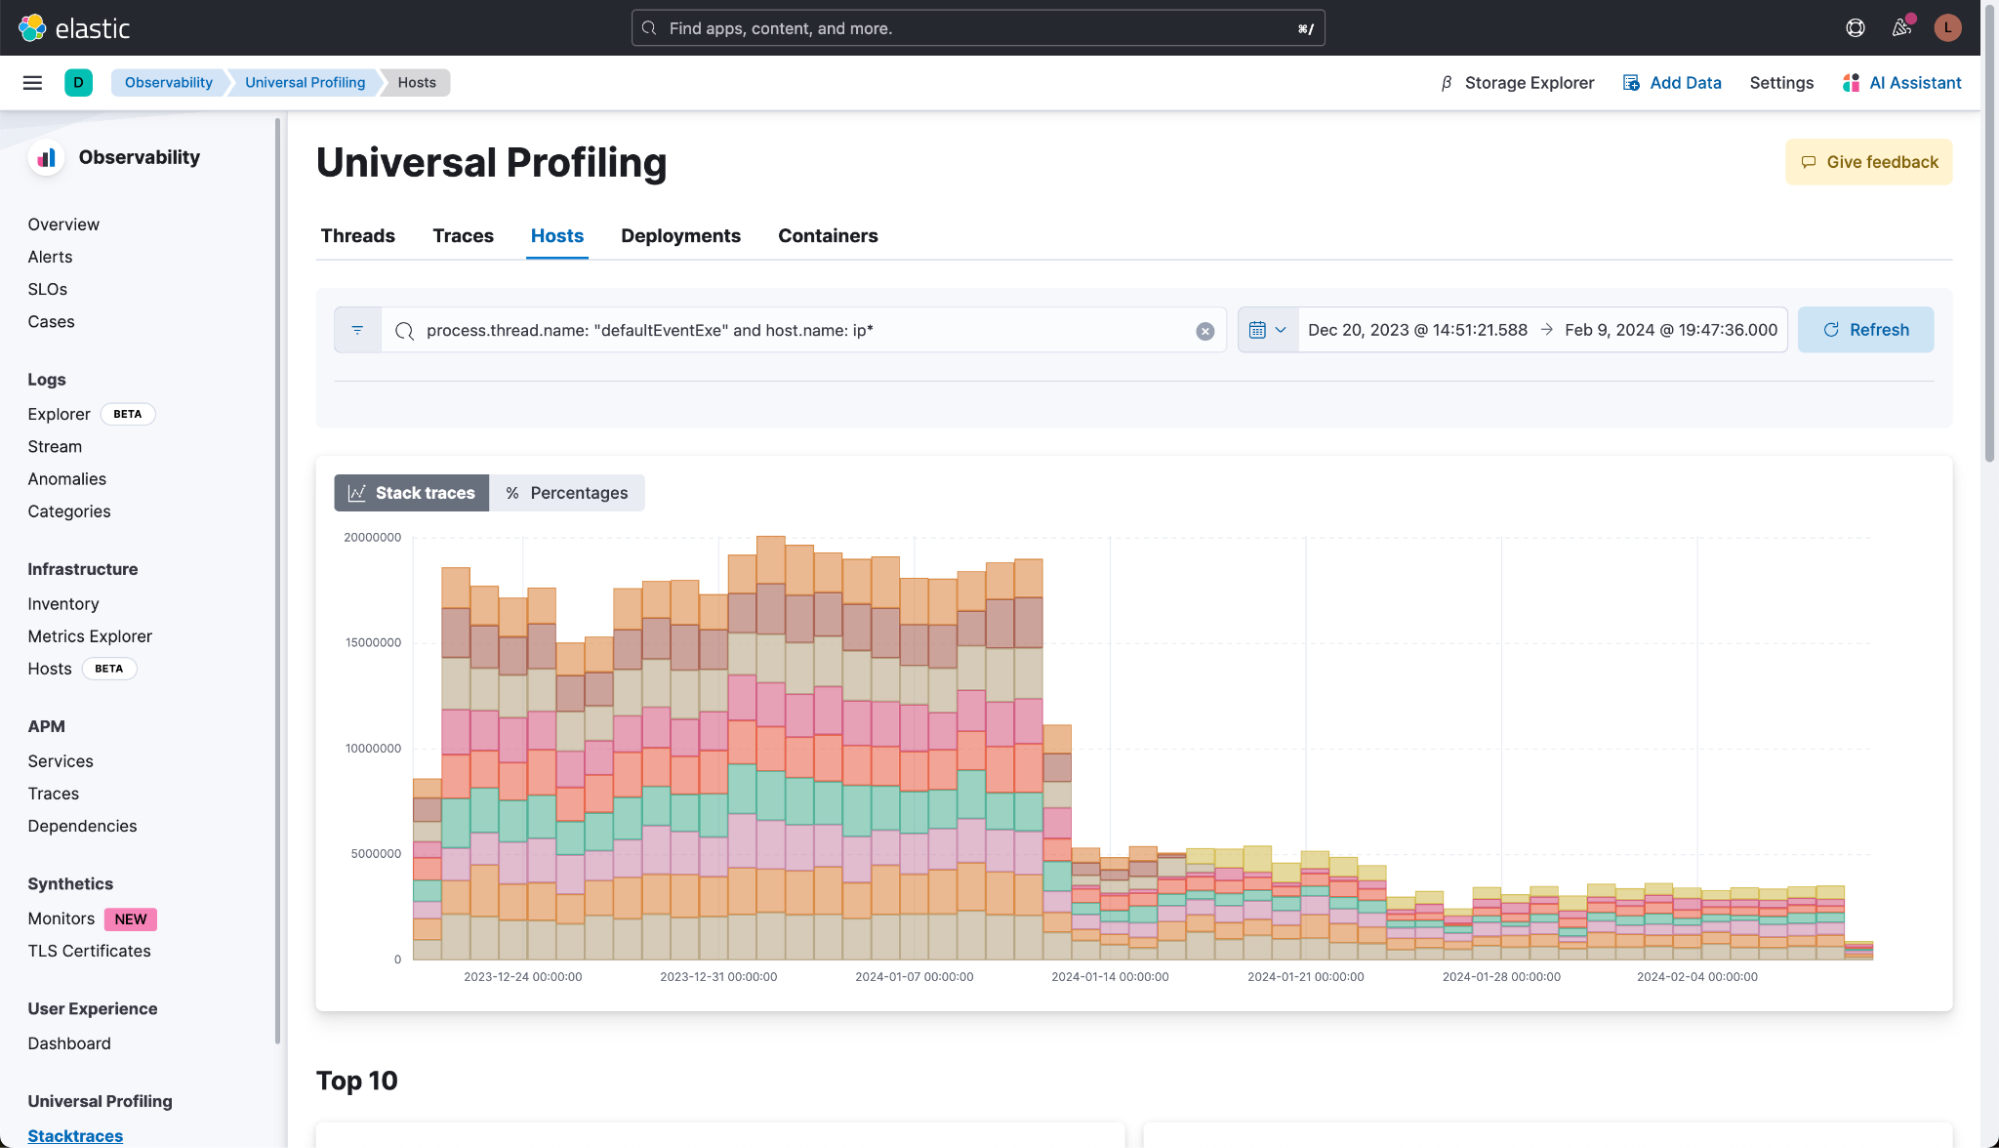
After rolling out this change to some of our hosts in the QA environment, the impact was immediately visible in the profiling data.
Single host:
Multiple hosts:
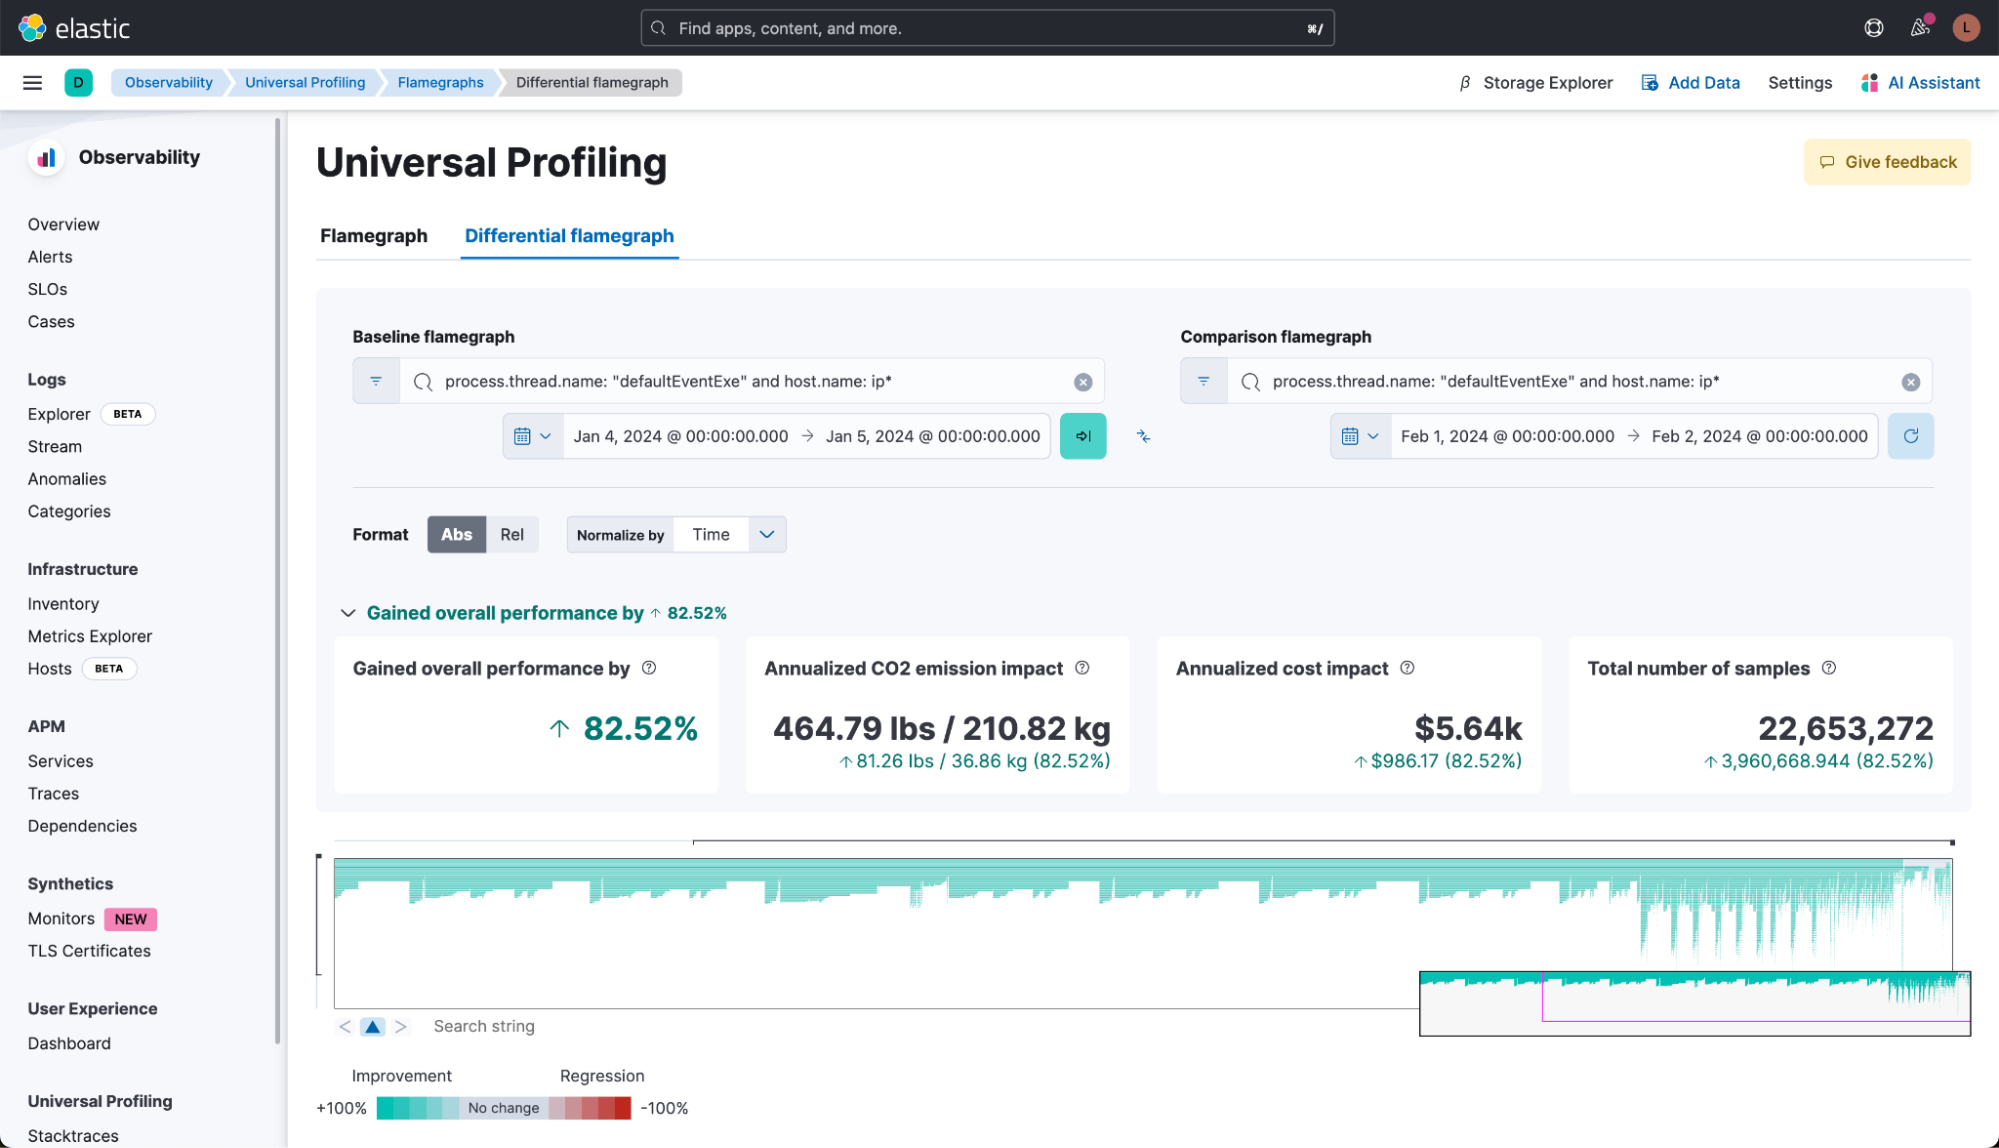
We can also use the differential flamegraph view to see the impact.
For this specific thread, we’re comparing one day of data from early January to one day of data from early February across a subset of hosts. Both the overall performance improvements as well as the CO2 and cost savings are dramatic.
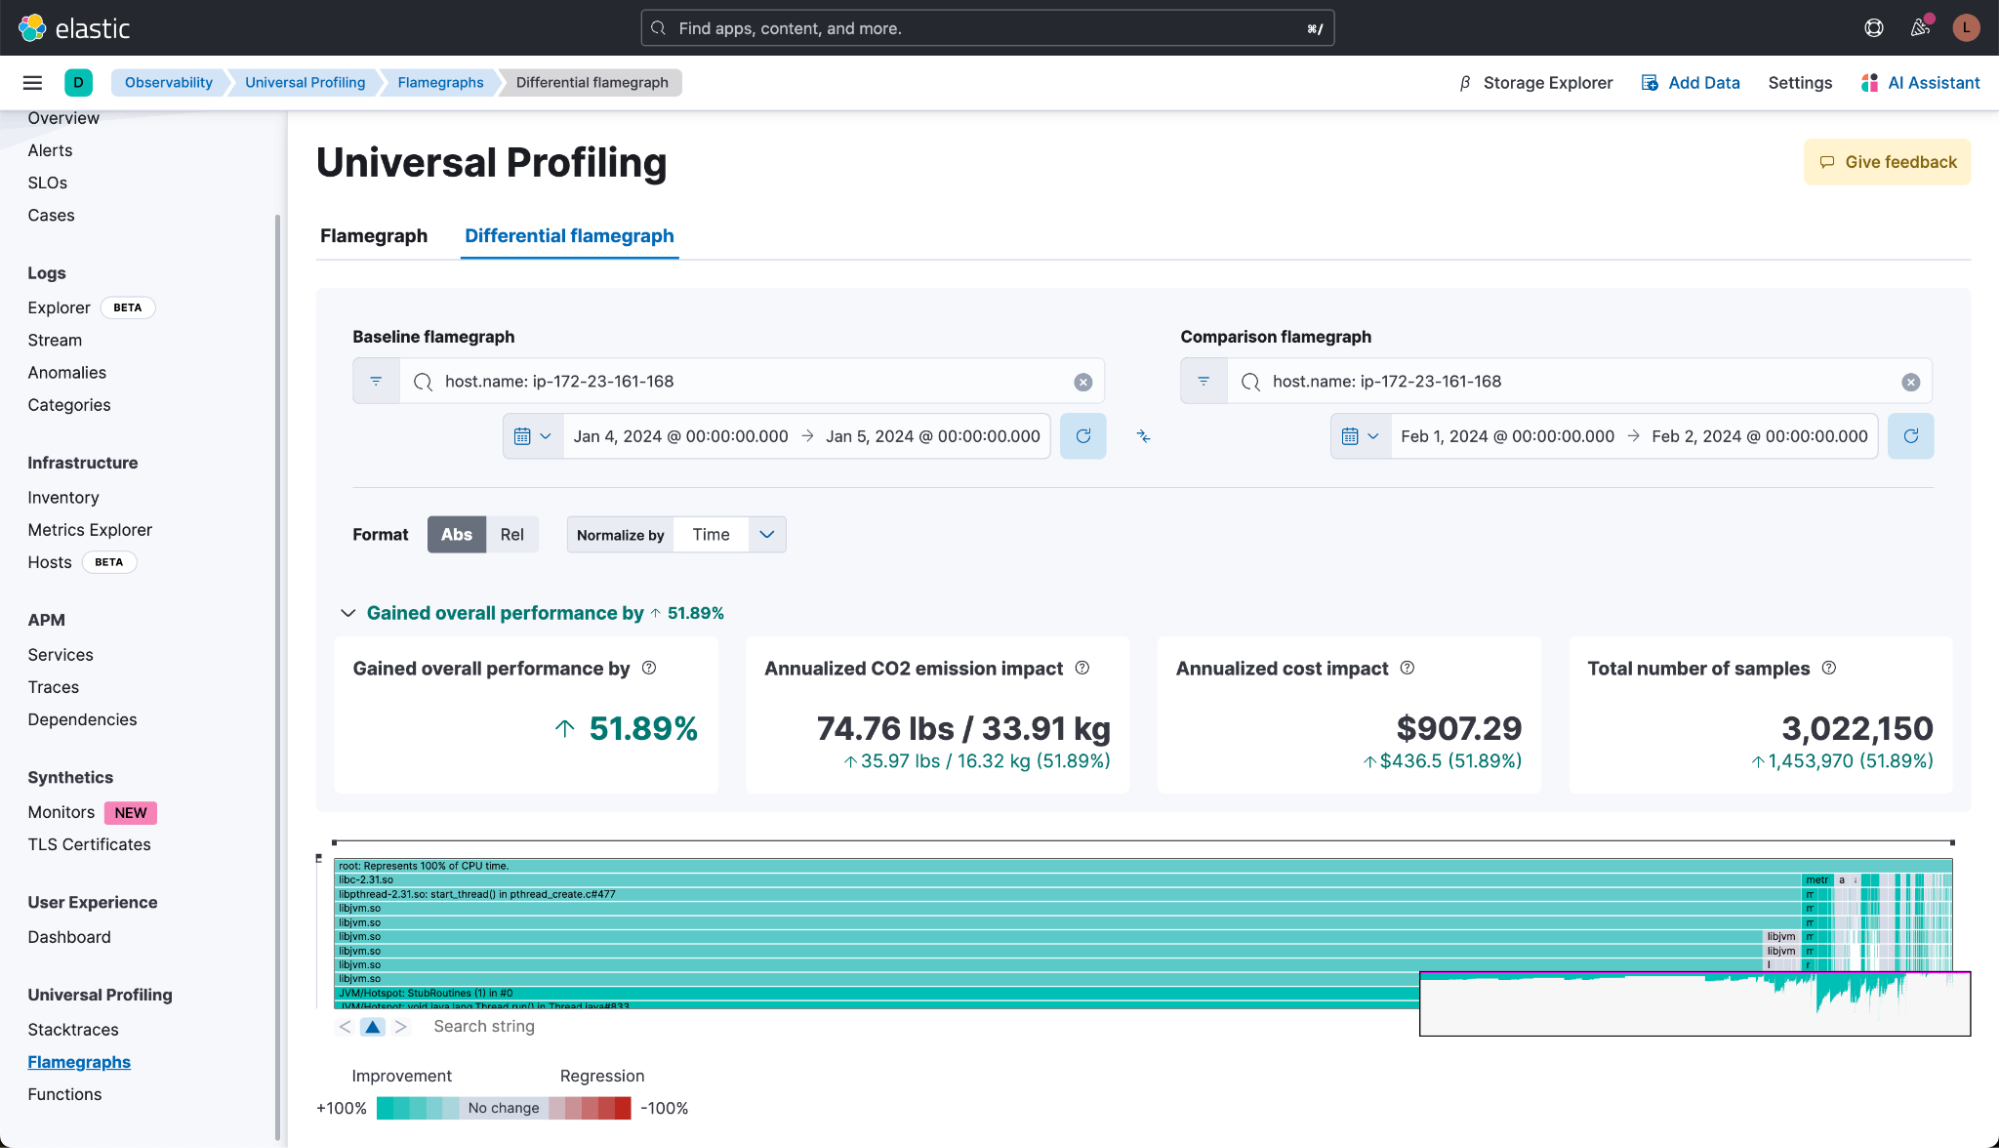
This same comparison can also be done for a single host. In this view, we’re comparing one host in early January to that same host in early February. The actual CPU usage on that host decreased by 50%, saving us approximately US$900 per year per host.
Fixing the issue in Logstash
In addition to the temporary workaround, we are working on shipping a proper fix for this behavior in Logstash. You can find more details in this issue, but the potential candidates are:
- Global default adjustment: One approach is to permanently set the maxOrder back to 11 for all instances by including this change in the jvm.options file. This global change would ensure that all Logstash instances use the larger default chunk size, reducing the need for allocations outside the pooled allocator.
- Custom allocator configuration: For more targeted interventions, we could customize the allocator settings specifically within the TCP, Beats, and HTTP inputs of Logstash. This would involve configuring the maxOrder value at initialization for these inputs, providing a tailored solution that addresses the performance issues in the most affected areas of data ingestion.
- Optimizing major allocation sites: Another solution focuses on altering the behavior of significant allocation sites within Logstash. For instance, modifying the frame decompression process in the Beats input to avoid using direct memory and instead default to heap memory could significantly reduce the performance impact. This approach would circumvent the limitations imposed by the reduced default chunk size, minimizing the reliance on large direct memory allocations.
Cost savings and performance enhancements
Following the new configuration change for Logstash instances on January 23, the platform's daily function cost dramatically decreased to US$350 from an initial >US$6,000, marking a significant 20x reduction. This change shows the potential for substantial cost savings through technical optimizations. However, it's important to note that these figures represent potential savings rather than direct cost reductions.
Just because a host uses less CPU resources, doesn’t necessarily mean that we are also saving money. To actually benefit from this, the very last step now is to either reduce the number of VMs we have running or to scale down the CPU resources of each one to match the new resource requirements.
This experience with Elastic Universal Profiling highlights how crucial detailed, real-time data analysis is in identifying areas for optimization that lead to significant performance enhancements and cost savings. By implementing targeted changes based on profiling insights, we've dramatically reduced CPU usage and operational costs in our QA environment with promising implications for broader production deployment.
Our findings demonstrate the benefits of an always-on, profiling driven approach in cloud environments, providing a good foundation for future optimizations. As we scale these improvements, the potential for further cost savings and efficiency gains continues to grow.
All of this is also possible in your environments. Learn how to get started today.
The release and timing of any features or functionality described in this post remain at Elastic's sole discretion. Any features or functionality not currently available may not be delivered on time or at all.


