- Observability: other versions:
- What is Elastic Observability?
- What’s new in 8.13
- Get started
- Observability AI Assistant
- Application performance monitoring (APM)
- Self manage APM Server
- Data Model
- Features
- How-to guides
- OpenTelemetry integration
- Manage storage
- Configure
- Advanced setup
- Secure communication
- Monitor
- API
- Troubleshoot
- Upgrade
- Release notes
- Known issues
- Log monitoring
- Infrastructure monitoring
- AWS monitoring
- Synthetic monitoring
- Get started
- Scripting browser monitors
- Configure lightweight monitors
- Manage monitors
- Work with params and secrets
- Analyze monitor data
- Monitor resources on private networks
- Use the CLI
- Configure projects
- Configure Synthetics settings
- Grant users access to secured resources
- Manage data retention
- Use Synthetics with traffic filters
- Migrate from the Elastic Synthetics integration
- Scale and architect a deployment
- Synthetics support matrix
- Synthetics Encryption and Security
- Troubleshooting
- Uptime monitoring
- Real user monitoring
- Universal Profiling
- Alerting
- Service-level objectives (SLOs)
- Cases
- CI/CD observability
- Troubleshooting
- Fields reference
- Tutorials
Rely on the most widely deployed observability solution, powered by machine learning and analytics, to converge metrics, logs, and traces that deliver unified visibility and actionable insights.
- Eliminate tool silos and efficiently store data
- Get visibility across hybrid and multi-cloud environments
- Monitor your digital experience — 24/7

What do you want to observe?
Use cases
Cloud monitoring
Cross-platform and multi-cloud visibility and analytics.
- Monitor Amazon Web Services (AWS)
Learn how to monitor AWS logs (VPC Flow and S3 access) and metrics (billing and EC2). - Monitor Microsoft Azure
Learn how to monitor Azure billing metrics and activity logs.
DevOps
Observe your entire software lifecycle — from development to production.
- CI/CD
Get better visibility into your CI/CD pipelines. - ECS logging
Leverage the Elastic Common Schema logging libraries to automatically link application traces to their corresponding logs.
AIOps
Automate anomaly detection and accelerate root cause analysis.
- Root cause analysis with logs
Learn about Elastic’s artificial intelligence for IT operations and machine learning capabilities for root cause analysis. - APM Correlations
Automatically identify the probable causes of slow or failed transactions.
User experience
Measure, gauge, and improve your end users’ experience.
- Scripting browser monitors
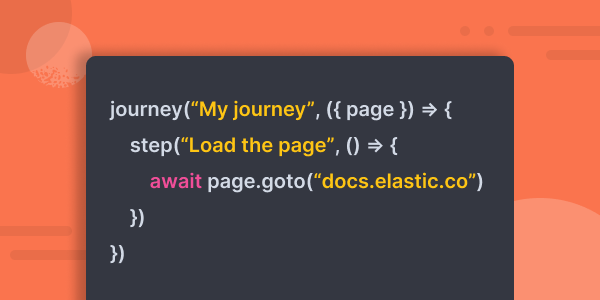
Simulate critical user workflows on a regular interval to catch bugs before your users report them. - User experience
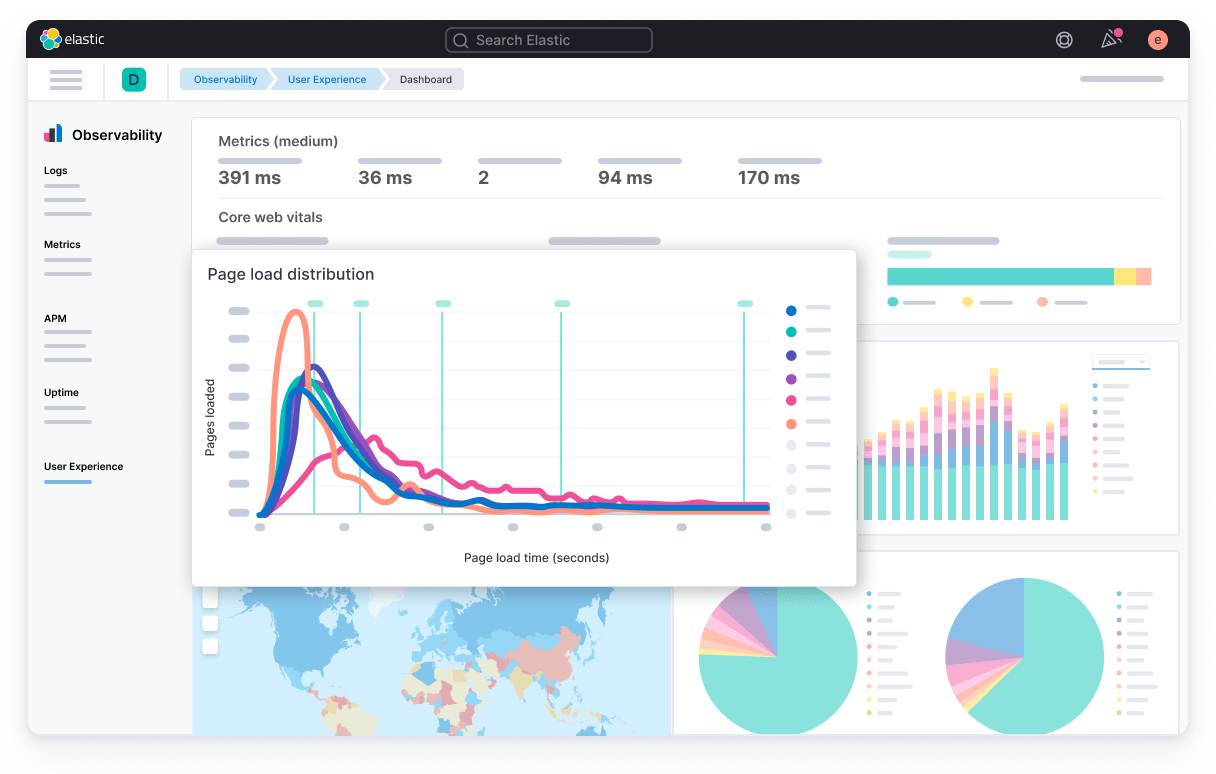
Learn how to track Core Web Vitals and how to use them to quantify the real-world user experience.

